18 Nov La Palma eruption update 18th November 2021: Slightly more intense activity seen
La Palma eruption – 18th November 2021
Daily summary
The more intense activity in the strombolian vents in the main cone that began on the 17th continues to be seen in the form of larger pyroclasts being emitted. From 8pm local time, an overflow of the lava channel by the cone was observed and was accompanied by an increase in lava emission rate. Regarding lava flows, the most active is flow number 4, which is 300 m from the sea between La Laguna and Todoque mountain. Flows 1, 2 and 9 feeding the lava delta are also active, and the total area affected by the lava flows is now 1,040 hectares. After the peak in earthquake frequency and magnitude on the 17th, the rate of seismicity dropped today. 92 events were recorded, with similar amounts at both intermediate (10-15 km) and deep (30-45 km) depths, with the day’s largest earthquake being a mbLg 4.4 event at 34 km depth.
SO2 emissions remained high and similar to the 17th at 17,000-26,000 tons per day, whilst the ash and gas plume was at 3,500 m. However, satellite measurements imply current SO2 emissions are lower than the start of the eruption. After a couple of days of increasing, the volcanic tremor decreased back to low levels, whilst deformation continued as seen since the start of November, with variable deformation at the LP03 GPS station in Jedey closest to the eruption and a small weakening regional deflation signal in the other stations. Air quality improved relative to the last two days, with SO2 levels reaching good or reasonably good in all stations on the island, except Tazacorte which exceeded the alert threshold (500 μg/m3) once in the late evening. PM10 levels improved in Los Llanos from unfavourable to reasonably good levels throughout the day, and in the rest of the stations PM10 levels remained between good and reasonably good.
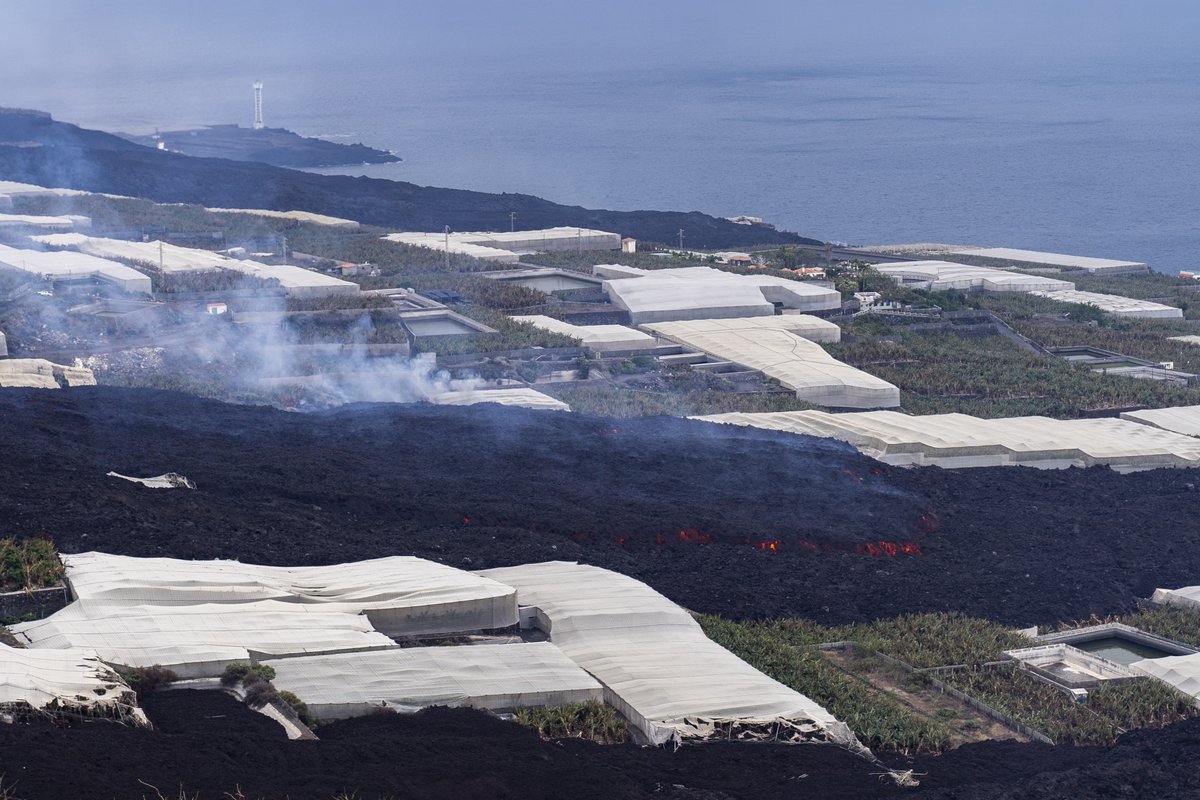
An image taken looking south from La Laguna mountain showing the progress of one of the active lava flows north of Todoque mountain, which is flowing over older flows causing them to thicken. Image credit: 112 Canarias, Government of the Canary Islands
Sources: Government of the Canary Islands, PEVOLCA, Involcan, IGN, DSN, Cabildo La Palma, 112 Canarias, Tolouse VAAC, Copernicus EMS
Lava flows

Earthquakes

Exclusion zone map
Exclusion zones shown here have been approximated from press releases from the Cabildo de La Palma and will not be exact, nor claim to be official maps of the exclusion zones. For official information, please contact the Cabildo de La Palma.

Official social media
To see our full social media archive, visit our open data section or click here.
News articles
- Market Research Telecast – Damage estimates from LP eruption – here
- Daily Express – La Palma rocked by 300 earthquakes in 24 hours – here
- Real Madrid – Real Madrid and Tenerife supporting La Palma – here
- El Pais – Two months of eruption in Figures – here
To see our full news archive, visit our open data section or click here.
Found a broken web link? We have archived all of our news articles on the WayBack Machine. You can view the pages by 1. pasting the broken link into WayBack Machine and clicking ‘Browse History’ 2. clicking on the latest capture date and then 3. clicking ‘view capture’. Please let us know of any broken web links by contacting us at enquiries@geotenerife.com.
Eruption footage
News and Interviews
Witness Testimonies
Interactive Lava Flow Map
Notes: Use the button in the top right to open the map into full screen mode. Use the legend icon in the top left to see the legend and further information about the map. Click on individual days to see an outline of the lava flows on that day.
Interactive Earthquake Map
click here to enlarge
Notes: The size of the points represents the size of the earthquake, and the colour represents the depth. The map will also only show a certain number of points at once. For ease of use, we recommend you uncheck all dates and the satellite basemap from the legend in the top right, and inspect the earthquakes one day at a time.
Sorry, the comment form is closed at this time.