11 Nov La Palma eruption update 11th November 2021: More than 1000 hectares now affected by lava flows
La Palma eruption – 11th November 2021
Daily summary
The area of hectares affected by the lava flows has exceeded 1000 hectares for the first time, currently reaching 1006 hectares, although the progress of the lava onto new ground is very incremental at the moment, with the vast majority of lava feeding flows 1 and 2 which are feeding the growing lava delta. The latest figures show that 290 hectares of crops including 164 hectares of bananas have been destroyed, along with 65 km of roads and 1,179 residential homes according to the local land registry. The number of earthquakes decreased after a couple of days of increase to 41, being at both intermediate (10-15 km) depths and increasingly at deeper (35-40 km) depths too, with the day’s largest earthquake being a mbLg 5.0 event at 36 km depth.
SO2 emissions continue to show a marked decrease relative to the 9th, at 7,000-21,000 tons per day, whilst the ash and gas plume reached 2500 m. However, satellite measurements imply current SO2 emissions show a downward trend since the start of the eruption. Currently, tremor remains stable at low levels as in the last days, and variable deformation continues to be seen at the LP03 GPS station in Jedey closest to the eruption, with a trend towards regional deflation at the other stations. Air quality improved again with respect to SO2. SO2 levels were good-reasonably good in all stations, and the hourly threshold (500 μg/m3) was only exceeded once, at 1pm local time in El Paso. Regarding PM10 levels, the daily threshold (50 μg/m3) was once again exceeded in Los Llanos with average values being classed as unfavourable, whereas all other stations remained at good or reasonably good levels.
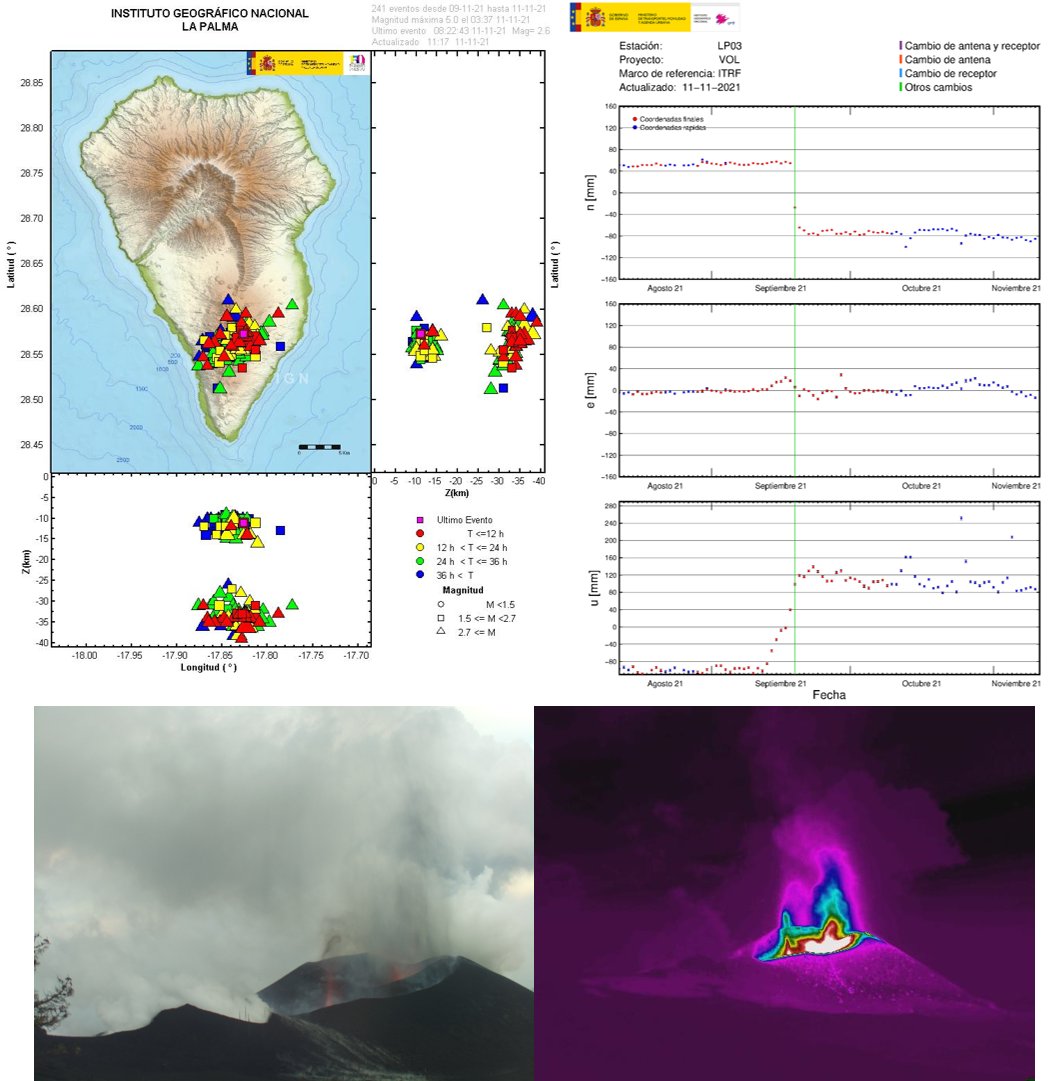
A selection of images showing the recent earthquakes on La Palma evidencing the increase of deep seismicity (top left); deformation at the station closest to the eruption, where the green line indicates the start of the eruption (top right); a visual image of the eruption on the 11th taken from the northeast of the main cone (bottom left); and a complementary thermal image taken from a similar place (bottom right). Image credit: IGN Spain
Sources: Government of the Canary Islands, PEVOLCA, Involcan, IGN, DSN, Cabildo La Palma, 112 Canarias, Tolouse VAAC, Copernicus EMS
Lava flows

Earthquakes

Exclusion zone map
Exclusion zones shown here have been approximated from press releases from the Cabildo de La Palma and will not be exact, nor claim to be official maps of the exclusion zones. For official information, please contact the Cabildo de La Palma.

Official social media
To see our full social media archive, visit our open data section or click here.
News articles
- MagicSeaWeed – Lava flows destroy the biggest surf spot on the island – here
- Reuters – Pictures of the day of the eruption – here
- RTVE – November 11th update – here
- Daily Mail – Bee colonies found alive under ash – here
To see our full news archive, visit our open data section or click here.
Found a broken web link? We have archived all of our news articles on the WayBack Machine. You can view the pages by 1. pasting the broken link into WayBack Machine and clicking ‘Browse History’ 2. clicking on the latest capture date and then 3. clicking ‘view capture’. Please let us know of any broken web links by contacting us at enquiries@geotenerife.com.
Eruption footage
News and Interviews
Witness Testimonies
Interactive Lava Flow Map
Notes: Use the button in the top right to open the map into full screen mode. Use the legend icon in the top left to see the legend and further information about the map. Click on individual days to see an outline of the lava flows on that day.
Interactive Earthquake Map
click here to enlarge
Notes: The size of the points represents the size of the earthquake, and the colour represents the depth. The map will also only show a certain number of points at once. For ease of use, we recommend you uncheck all dates and the satellite basemap from the legend in the top right, and inspect the earthquakes one day at a time.
Sorry, the comment form is closed at this time.