12 Nov La Palma eruption update 12th November 2021: The lava delta is now expanding to the south
La Palma eruption – 12th November 2021
Daily summary
The two lava flows feeding the lava delta, flows 1 and 2, have now combined both in the sea forming a single large lava delta, and also on land too close to the cliffs. Other than these flows, flow number 9 which is further south of the current lava delta and is on the 1949 lava delta, is also active. Due to the lava-water interactions, turbulent currents have been detected up to 1 km from the lava front. Whilst these currents can be damaging to marine life, the chemical parameters of the ocean are not thought to be significantly affected at this distance from the front of the lava delta. Regarding earthquakes the frequency and magnitude remained similar to the 11th. 36 events were recorded, with similar amounts at both intermediate (10-15 km) and deeper (35-40 km) depths, with the day’s largest earthquake being a mbLg 4.3 event at 38 km depth.
SO2 emissions remained fairly high at 14,000-20,000 tons per day, whilst the ash and gas plume reached 2900 m. However, satellite measurements imply current SO2 emissions show a downward trend since the start of the eruption. Tremor continues to be stable at low levels as in the last days, and variable deformation continues to be seen at the LP03 GPS station in Jedey closest to the eruption, with a trend towards regional deflation at the other stations. Regarding air quality, SO2 levels were good in all stations except Los Llanos and Puntagorda which exceeded the daily threshold (125 μg/m3). Regarding PM10 levels, Los Llanos suffered unfavourable levels again between 9am-12pm local time, but these reduced to reasonably good levels for the rest of the day, levels which have not been seen in Los Llanos for many days. In all other stations, PM10 levels were good or reasonably good throughout the day.
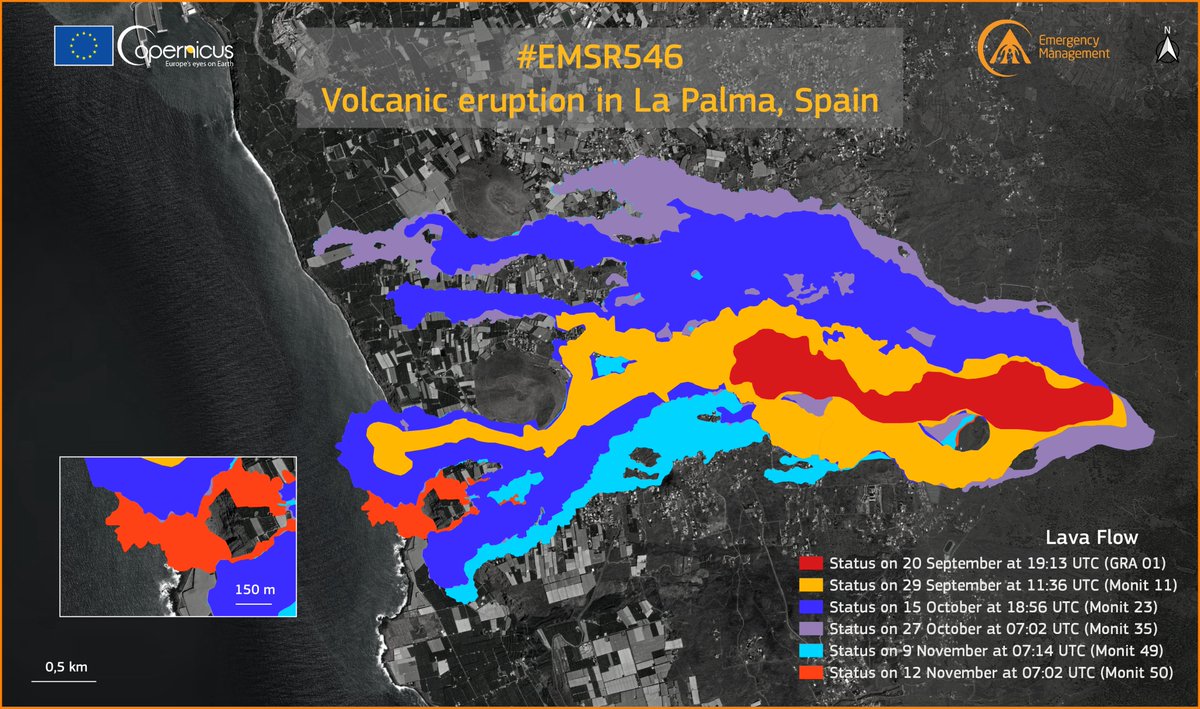
The latest available data on the extent of the lava flows, showing the southern expansion of the lava delta. Image credit: Copernicus EMS
Sources: Government of the Canary Islands, PEVOLCA, Involcan, IGN, DSN, Cabildo La Palma, 112 Canarias, Tolouse VAAC, Copernicus EMS
Lava flows

Earthquakes

Exclusion zone map
Exclusion zones shown here have been approximated from press releases from the Cabildo de La Palma and will not be exact, nor claim to be official maps of the exclusion zones. For official information, please contact the Cabildo de La Palma.

Official social media
To see our full social media archive, visit our open data section or click here.
News articles
- El Pais – How to read the signs of an eruption – here
- CostaLuz Lawyers – Who is compensating losses in La Palma? – here
To see our full news archive, visit our open data section or click here.
Found a broken web link? We have archived all of our news articles on the WayBack Machine. You can view the pages by 1. pasting the broken link into WayBack Machine and clicking ‘Browse History’ 2. clicking on the latest capture date and then 3. clicking ‘view capture’. Please let us know of any broken web links by contacting us at enquiries@geotenerife.com.
Eruption footage
News and Interviews
Witness Testimonies
Interactive Lava Flow Map
Notes: Use the button in the top right to open the map into full screen mode. Use the legend icon in the top left to see the legend and further information about the map. Click on individual days to see an outline of the lava flows on that day.
Interactive Earthquake Map
click here to enlarge
Notes: The size of the points represents the size of the earthquake, and the colour represents the depth. The map will also only show a certain number of points at once. For ease of use, we recommend you uncheck all dates and the satellite basemap from the legend in the top right, and inspect the earthquakes one day at a time.
Sorry, the comment form is closed at this time.