16 Nov La Palma eruption update 16th November 2021: The eruption shows a general decrease in energy
La Palma eruption – 16th November 2021
Daily summary
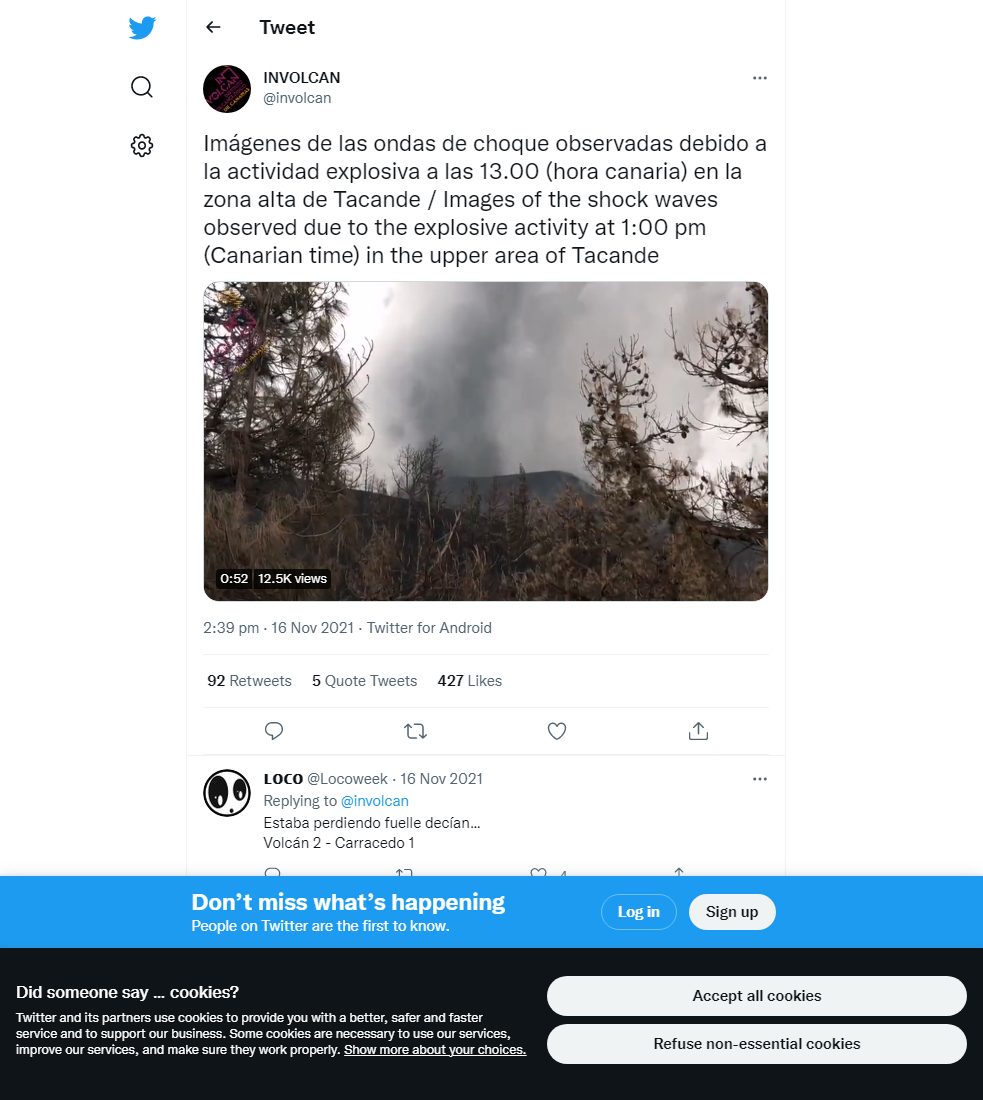
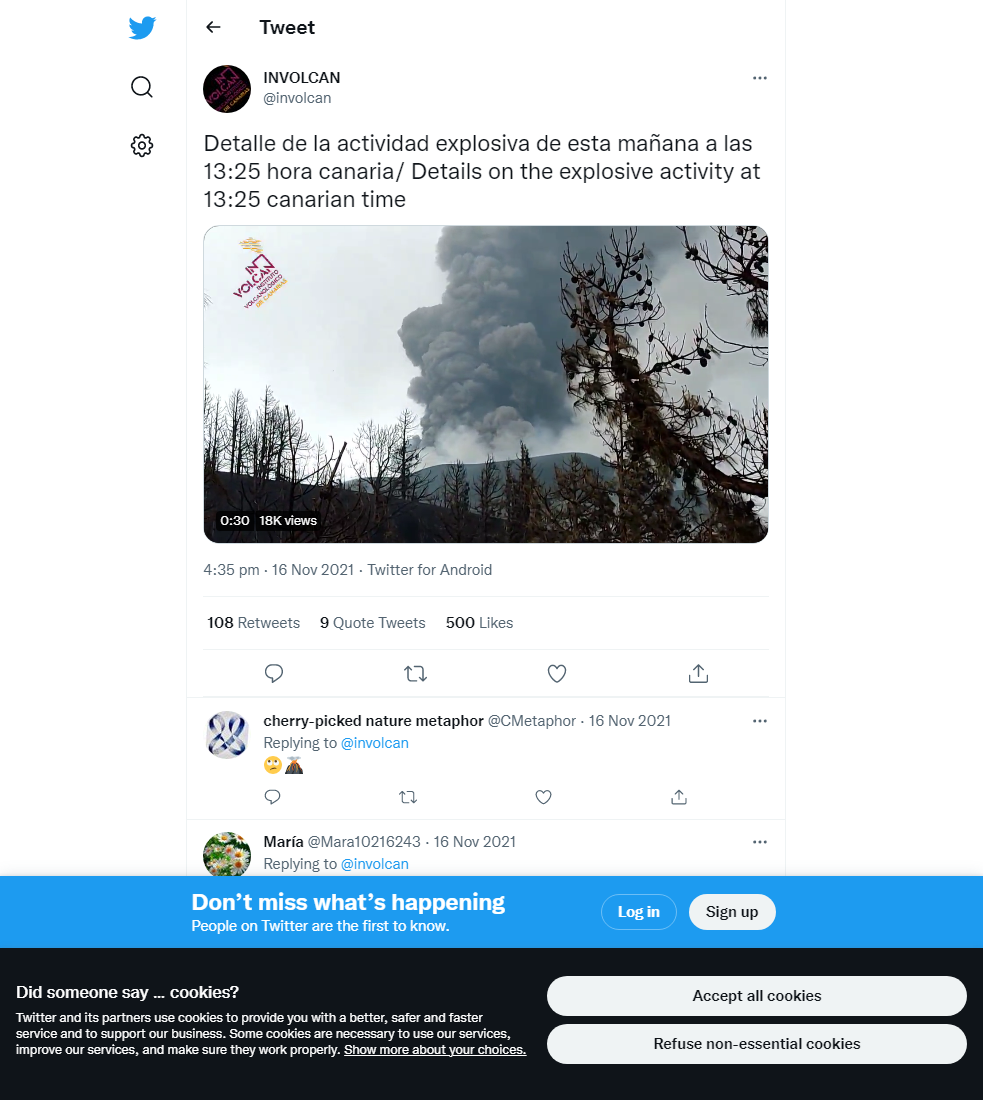
The eruption continues to show some stability and a general decrease in energy, although PEVOLCA reminds that the current eruption parameters do not indicate a possible end to the eruption in the short term. However, there was increased ash emission observed yesterday, which has led to a worsening of air quality and the suspension of classroom teaching in the municipalities closest to the eruption. Furthermore, the poor air quality has caused the cancellation of some flights at La Palma airport. Regarding earthquakes the frequency and magnitude increased relative to the 15th. 79 events were recorded, with similar amounts at both intermediate (10-15 km) and deeper (30-45 km) depths, with the day’s largest earthquake being a mbLg 4.2 event at 36 km depth.
SO2 emissions decreased to levels seen on the 13th, at 2,000-3,000 tons per day, whilst the ash and gas plume again reached 3,000 m. However, satellite measurements imply current SO2 emissions show a downward trend since the start of the eruption. Tremor continues to be stable at low levels as seen since the start of November, and variable deformation continues to be seen at the LP03 GPS station in Jedey closest to the eruption, whilst the rate of regional deflation seen since the start of November in the other stations has decreased. The worsening of air quality is reflected in the SO2 levels, which reached very unfavourable levels at Los Llanos and Puntagorda in the early hours, with a total of 4 exceedances of the hourly alert threshold (500 μg/m3), contributing to the exceedance of the average daily threshold (125 μg/m3). However, the rest of the stations registered good or reasonably good SO2 concentrations. PM10 concentrations again reached extremely unfavourable levels in Los Llanos in the morning before decreasing to low levels in the afternoon, whilst still exceeding the daily threshold (50 μg/m3). Like SO2 levels, PM10 levels in the remainder of the stations remained good or reasonably good.
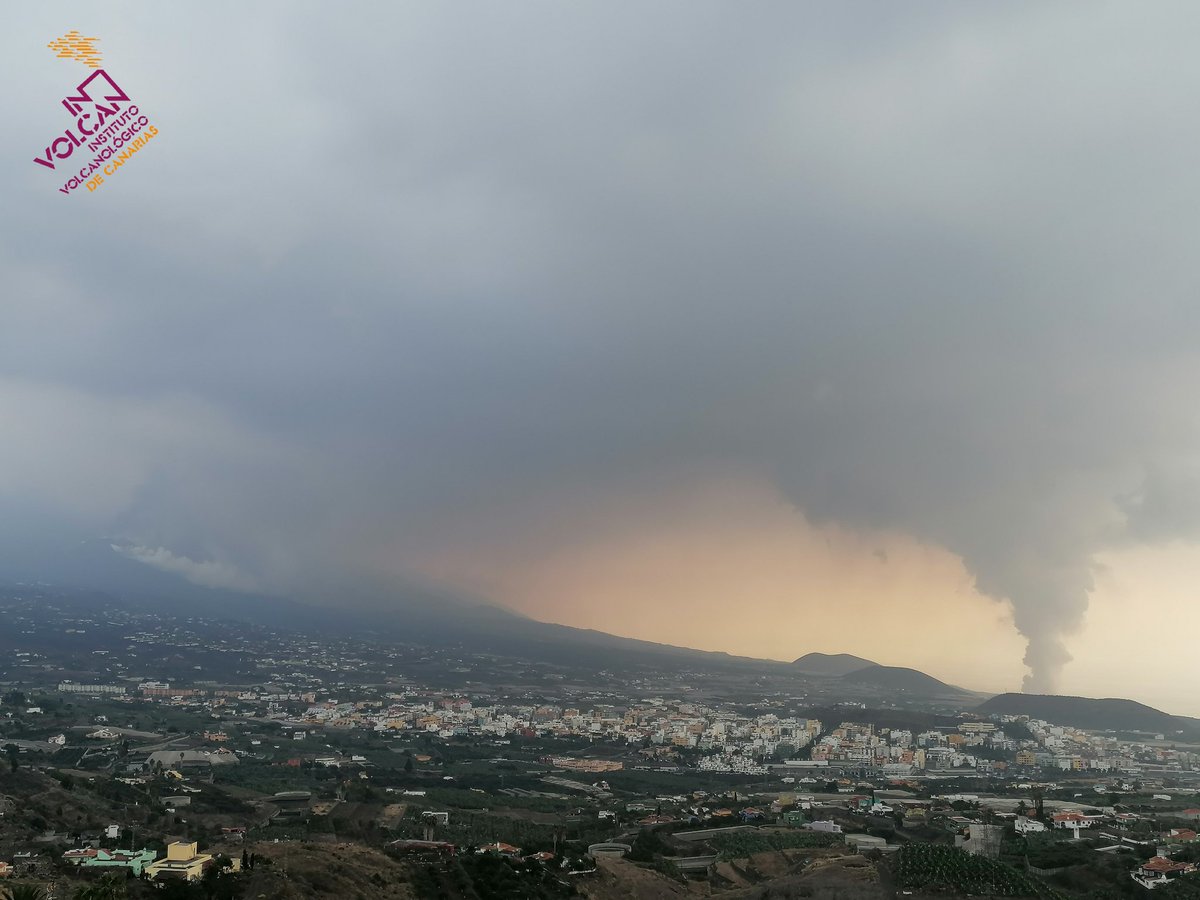
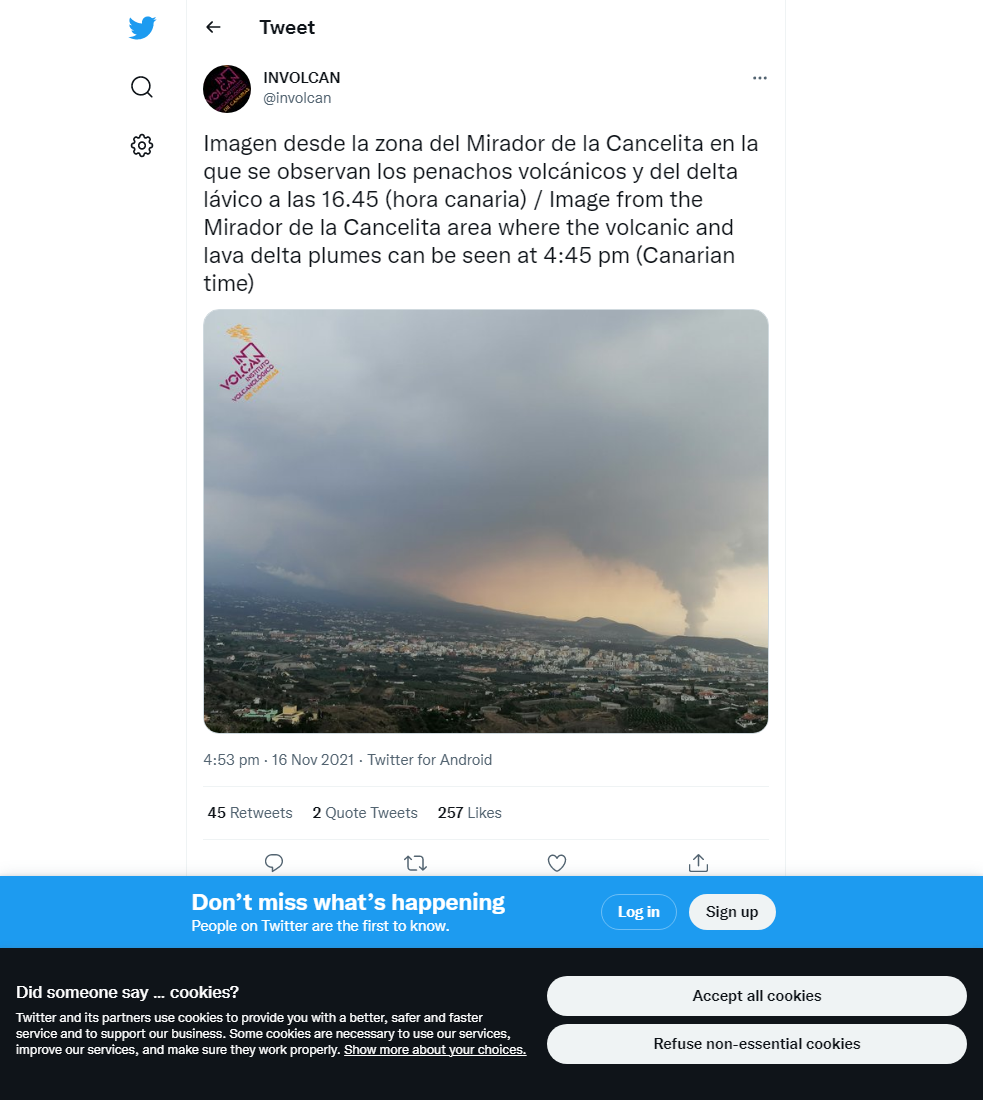
A picture of the eruption on the 16th taken from north of Los Llanos (built up area in the foreground), showing clearly the plume from the main cone (left) and the plume created by the cooling of lava on the lava delta (far right). Image credit: INVOLCAN
Sources: Government of the Canary Islands, PEVOLCA, Involcan, IGN, DSN, Cabildo La Palma, 112 Canarias, Tolouse VAAC, Copernicus EMS
Lava flows

Earthquakes

Exclusion zone map
Exclusion zones shown here have been approximated from press releases from the Cabildo de La Palma and will not be exact, nor claim to be official maps of the exclusion zones. For official information, please contact the Cabildo de La Palma.

Official social media


To see our full social media archive, visit our open data section or click here.
News articles
- The Conversation – Will the maps of La Palma have to be changed after the eruption? – here
- RTVE – La Palma updates: LIVE – here
To see our full news archive, visit our open data section or click here.
Found a broken web link? We have archived all of our news articles on the WayBack Machine. You can view the pages by 1. pasting the broken link into WayBack Machine and clicking ‘Browse History’ 2. clicking on the latest capture date and then 3. clicking ‘view capture’. Please let us know of any broken web links by contacting us at enquiries@geotenerife.com.
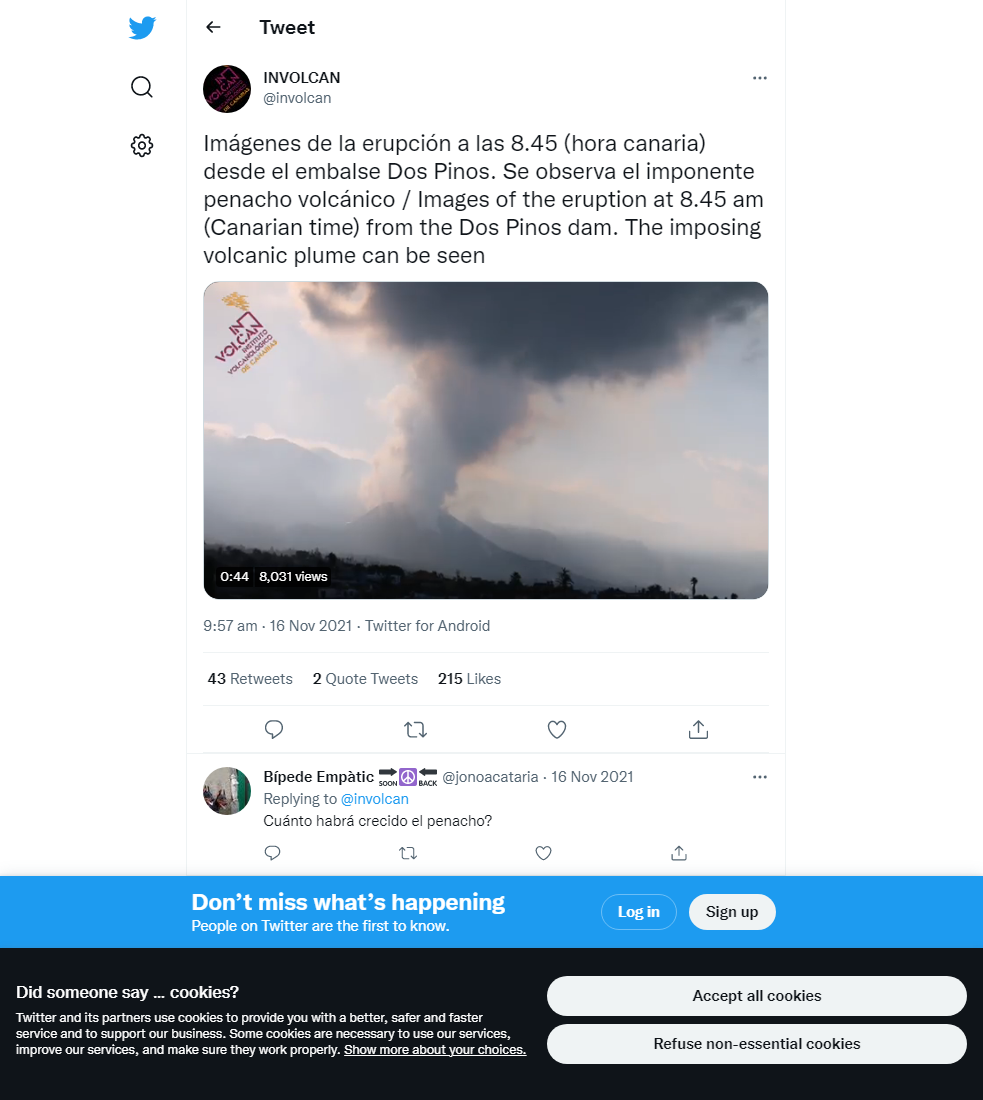
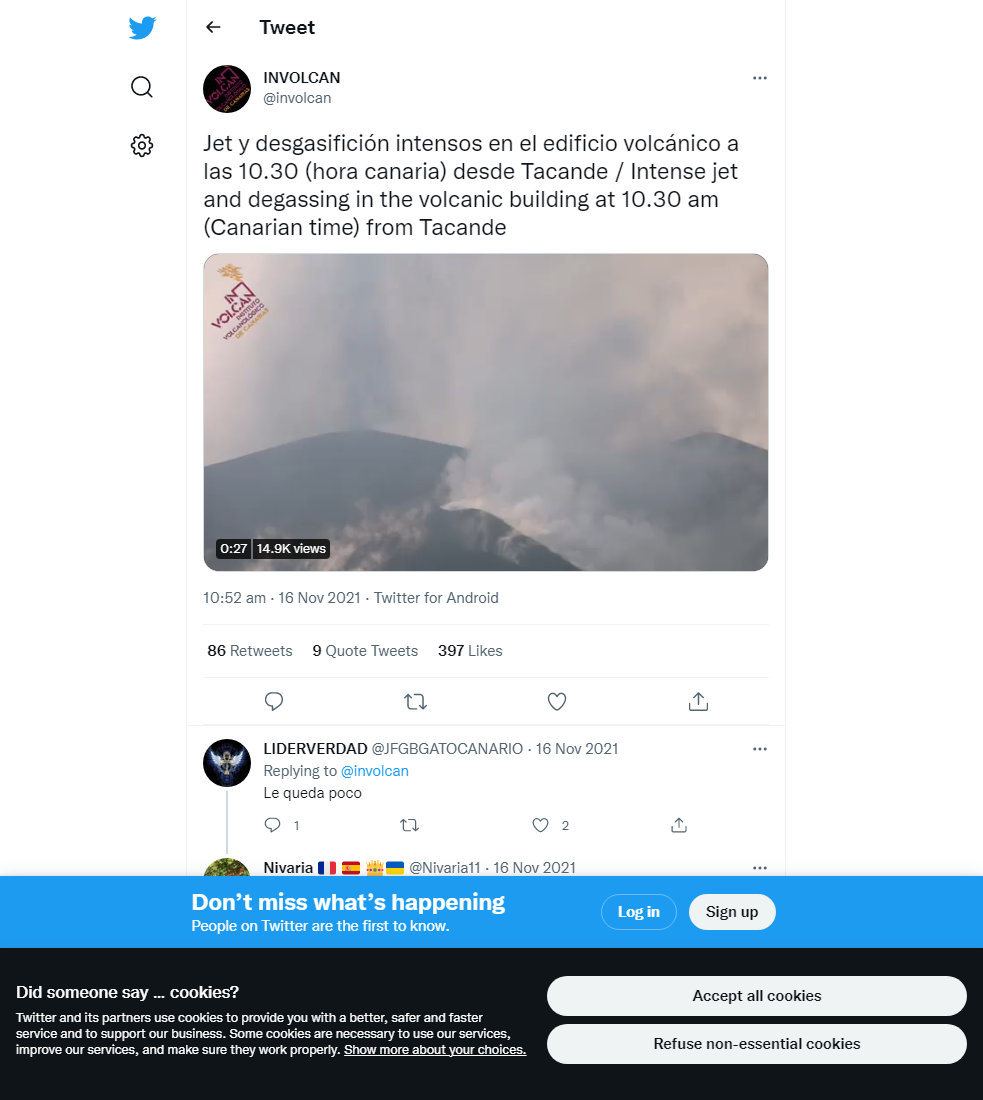
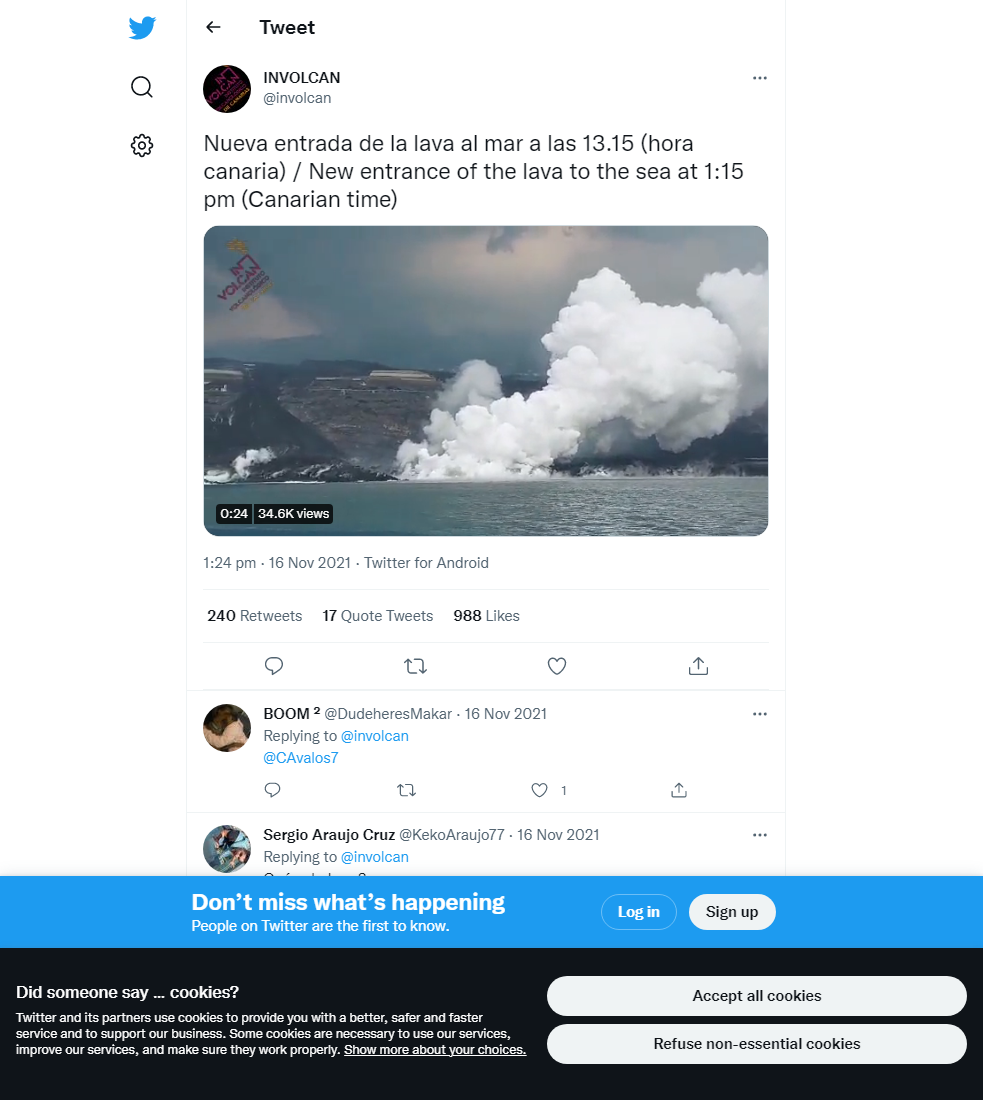
Eruption footage
News and Interviews
Witness Testimonies
Interactive Lava Flow Map
Notes: Use the button in the top right to open the map into full screen mode. Use the legend icon in the top left to see the legend and further information about the map. Click on individual days to see an outline of the lava flows on that day.
Interactive Earthquake Map
click here to enlarge
Notes: The size of the points represents the size of the earthquake, and the colour represents the depth. The map will also only show a certain number of points at once. For ease of use, we recommend you uncheck all dates and the satellite basemap from the legend in the top right, and inspect the earthquakes one day at a time.
Sorry, the comment form is closed at this time.