09 Dec La Palma eruption update 9th december 2021: Seismicity remains at lower levels than the previous week
La Palma eruption update 9th december 2021: Seismicity remains at lower levels than the previous week
Daily summary
The eruption enters its 82nd day, still showing mixed strombolian activity and ash emission from several vents in the centre and southeast of the main cone. There also remains active effusive vents located to the west of the main cone emitting fluid lava flows. The only current active lava flows are those feeding flow 9, which represents the southern end of the lava delta and the flow occupying the lava delta (fajana) from the 1949 eruption. The lava flow to the south that was affecting new ground however appears to have become inactive. The cracks seen in the secondary cone have been confirmed to have produced small landslides modifying the morphology of the cones, although this has not affected broader edifice stability.
Seismicity remains low, with only 20 events being recorded yesterday, peaking at M3.0, being recorded largely at intermediate depths (<20 km). This trend is also mirrored in the tremor, which remains low with little variability, as in previous days. Deformation too remains similar throughout the network, with no observable trends close to the eruptive centre, and stability in more distal stations.
The SO2 emissions from the plume remains categorised as high although showing a decreasing trend. Today, access to the evacuated zone is only allowed from the north entrance, due to high gas levels to the south. Further away, SO2 concentrations are better than two days ago although increased yesterday, being regular in Puntagorda, Los Llanos de Aridane and Tazacorte, and good everywhere else. PM10 levels have decreased over the last couple of days, and were good in all stations yesterday except for Los Llanos de Aridane, which maintained reasonably good levels.
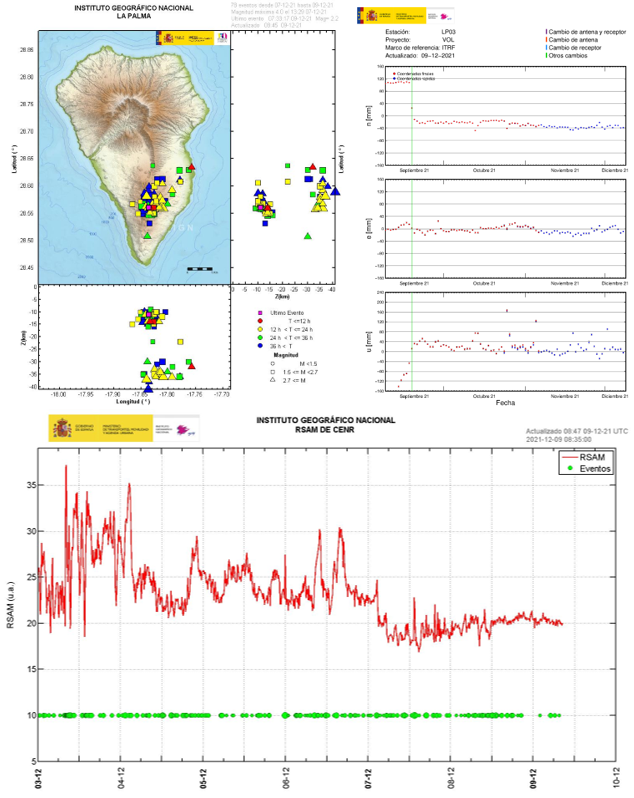
An overview of the eruption on the 9th December showing the earthquakes in the last 3 days (top left), the deformation since the start of the eruption at the GPS station closest to the eruption (top right) and the volcanic tremor since the start of the eruption (bottom). Image credit: IGN Spain
Sources: Government of the Canary Islands, PEVOLCA, Involcan, IGN, DSN, Cabildo La Palma, 112 Canarias, Tolouse VAAC, Copernicus EMS
Lava flows

Earthquakes

Exclusion zone map
Exclusion zones shown here have been approximated from press releases from the Cabildo de La Palma and will not be exact, nor claim to be official maps of the exclusion zones. For official information, please contact the Cabildo de La Palma.

Official social media
To see our full social media archive, visit our open data section or click here.
News articles
- BlackLine Safety – Gas monitors used during the eruption – here
- El País – Signs of lowering intensity – here
To see our full news archive, visit our open data section or click here.
Found a broken web link? We have archived all of our news articles on the WayBack Machine. You can view the pages by 1. pasting the broken link into WayBack Machine and clicking ‘Browse History’ 2. clicking on the latest capture date and then 3. clicking ‘view capture’. Please let us know of any broken web links by contacting us at enquiries@geotenerife.com.
Eruption footage
News and Interviews
Witness Testimonies
Interactive Lava Flow Map
Notes: Use the button in the top right to open the map into full screen mode. Use the legend icon in the top left to see the legend and further information about the map. Click on individual days to see an outline of the lava flows on that day.
Interactive Earthquake Map
click here to enlarge
Notes: The size of the points represents the size of the earthquake, and the colour represents the depth. The map will also only show a certain number of points at once. For ease of use, we recommend you uncheck all dates and the satellite basemap from the legend in the top right, and inspect the earthquakes one day at a time.
Sorry, the comment form is closed at this time.