11 Oct La Palma eruption update 11th october 2021: Smoke from burning buildings forces confinements
La Palma eruption update 11th october 2021: Smoke from burning buildings forces confinements
Daily summary
A confinement of several population centres in Los Llanos de Aridane and El Paso totalling 3,500 people was ordered in the morning, due to the release of toxic gases from a large fire in a cement factory in the Callejón de la Gata industrial park, ignited by the northern active lava flow. There are currently three active lava streams: the original one feeding the lava delta, one to the south of the lava delta on the delta from the 1949 eruption, and the stream to the north which consists of two branches. The stream to the north currently has the greatest supply of lava, and has one branch affecting the industrial park, whilst the other branch is covering new ground in the direction of Todoque Mountain. To the north of Todoque mountain, the original stream is 300 m away from the coast and could form a second lava delta in the coming days if the supply of lava continues.
The thermal inversion was lower than usual, and the wind direction meant ashfall started to affect the eastern side of the island, including the airport. However, SO2 and PM10 concentrations remained within largely acceptable levels. There was a large SO2 peak of 830 μg/m3 at 8:00 am local time at the El Paso station exceeding the hourly threshold, but all other stations remained below the threshold throughout the day. PM10 concentrations were elevated in Los Llanos between 9:00-12:00am, although values remained low elsewhere. For other eruption parameters, deformation remains stable, with no significant trends being seen in the stations close to the eruption site. Earthquake activity again remains elevated and concentrated at 10-15 km depth, although there have been more deep (20-40 km) earthquakes reported in the last couple of days. 77 events were recorded, peaking at 3.6 mbLg. The ash and gas plume reached 4000 m, and the SO2 emissions from the volcano were measured higher than previous days at 21,868 tons per day, although this is an underestimate.
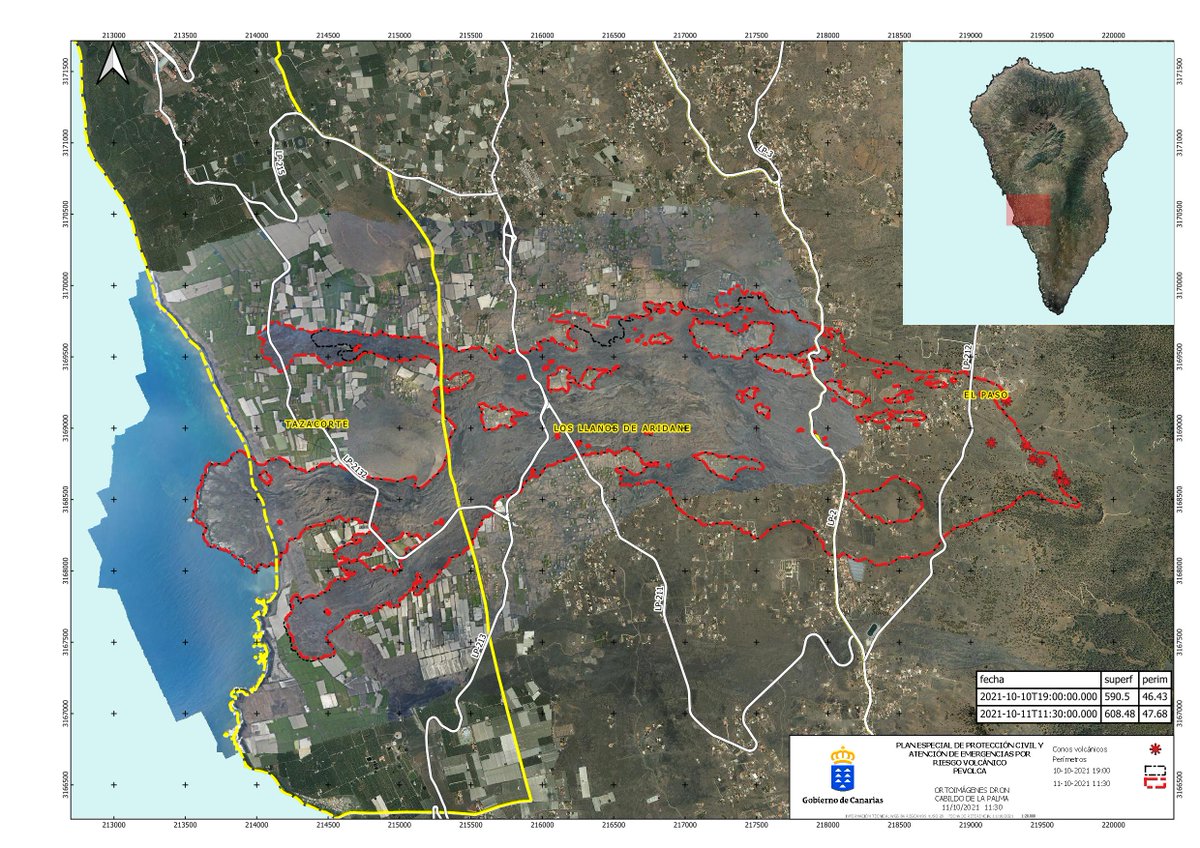
A map and showing the extent of the lava flows seen on the 10th (black perimeter) and 11th (red perimeter) of October. The areas of advance in the north and northeast portions of the lava flow field are the current most active flows, with the northeast flow the one affecting the cement factory. Image credit: Government of the Canary Islands
Sources: Government of the Canary Islands, PEVOLCA, Involcan, IGN, DSN, Cabildo La Palma, 112 Canarias, Tolouse VAAC, Copernicus EMS
Lava flows

Earthquakes

Exclusion zone map
Exclusion zones shown here have been approximated from press releases from the Cabildo de La Palma and will not be exact, nor claim to be official maps of the exclusion zones. For official information, please contact the Cabildo de La Palma.

Official social media
To see our full social media archive, visit our open data section or click here.
News articles
- ESA – La Palma volcano: How satellites help us monitor eruptions – here
- INews – La Palma volcano eruption map: where the lava flow has affected and latest Canary Islands travel advice – here
To see our full news archive, visit our open data section or click here.
Found a broken web link? We have archived all of our news articles on the WayBack Machine. You can view the pages by 1. pasting the broken link into WayBack Machine and clicking ‘Browse History’ 2. clicking on the latest capture date and then 3. clicking ‘view capture’. Please let us know of any broken web links by contacting us at enquiries@geotenerife.com.
Eruption footage
News and Interviews
Witness Testimonies
Interactive Lava Flow Map
Notes: Use the button in the top right to open the map into full screen mode. Use the legend icon in the top left to see the legend and further information about the map. Click on individual days to see an outline of the lava flows on that day.
Interactive Earthquake Map
click here to enlarge
Notes: The size of the points represents the size of the earthquake, and the colour represents the depth. The map will also only show a certain number of points at once. For ease of use, we recommend you uncheck all dates and the satellite basemap from the legend in the top right, and inspect the earthquakes one day at a time.
Sorry, the comment form is closed at this time.