13 Dec La Palma eruption update 13th december 2021: Intermittent cessations of volcanic tremor and eruptive activity observed
La Palma eruption update 13th december 2021: Intermittent cessations of volcanic tremor and eruptive activity observed
Daily summary
The volcano has entered a new eruptive phase, which began with the intensification of tremor on the 12th. Since then, the tremor has been extremely variable, with peaks throughout yesterday coinciding with intense phases of explosive strombolian activity and ash emission, producing strong and high eruption columns. Yesterday evening however, tremor signals ceased entirely, and this remained the case until this morning when a brief spike in tremor has been seen. In the evening, tremor again ceased completely, as did activity from any of the vents. The number of earthquakes increased yesterday to 71 events, peaking at M3.4. However, some of this increase is due to the fact that when there is no tremor, more lower magnitude events (<M2.0) can be located, according to IGN. Seismicity again remains concentrated at intermediate (<20 km) depths.
Regarding the confinement of El Paso, Los Llanos de Aridane and Tazacorte yesterday morning due to extremely unfavourable SO2 concentrations, the confinement order was lifted early afternoon due to the dispersal of the gases. The SO2 concentrations also reached very unfavourable values in Puntagorda during this time and reached alert levels in El Pilar too on the eastern slope of the island. However, the rest of the stations remained at ‘good’ levels. PM10 concentrations continued to fluctuate slightly yesterday, but remained at reasonably good to good throughout the island.
The lava flows have shown limited evolution over the last couple of days, with some slight ‘filling in’ of the areas between flows number 9 and 11 at the southern margin of the lava flow field. These flows are fed by the secondary cone that has grown to the eastern side of the main cone, which has enlarged over the last day or so due to new small collapses within the main cone.
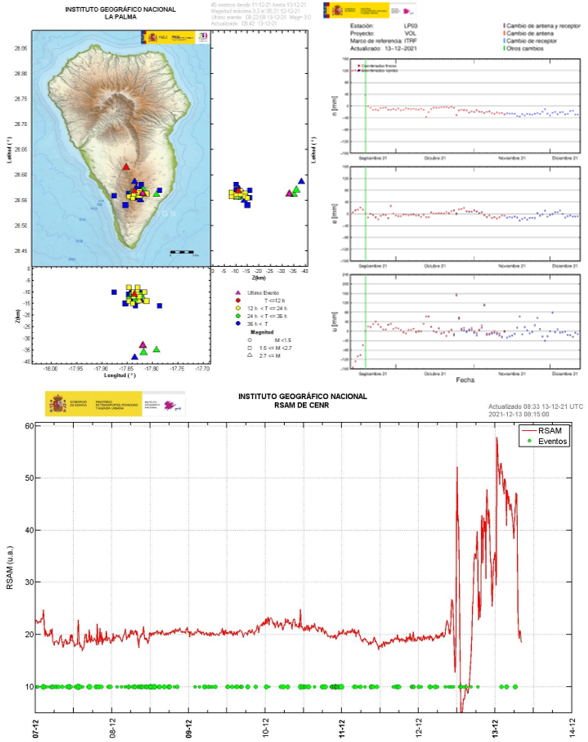
An overview of the eruption on the 13th December showing the earthquakes in the last 3 days (top left), the deformation since the start of the eruption at the GPS station closest to the eruption (top right) and the volcanic tremor since the start of the eruption (bottom). The tremor data was captured before the return to background levels on the evening of the 13th. Image credit: IGN Spain
Sources: Government of the Canary Islands, PEVOLCA, Involcan, IGN, DSN, Cabildo La Palma, 112 Canarias, Tolouse VAAC, Copernicus EMS
Lava flows

Earthquakes

Exclusion zone map
Exclusion zones shown here have been approximated from press releases from the Cabildo de La Palma and will not be exact, nor claim to be official maps of the exclusion zones. For official information, please contact the Cabildo de La Palma.

Official social media
To see our full social media archive, visit our open data section or click here.
News articles
- CBS News – Confinements and stay indoors because of air quality – here
- El País – Lockdown lifted due to air quality improvement – here
To see our full news archive, visit our open data section or click here.
Found a broken web link? We have archived all of our news articles on the WayBack Machine. You can view the pages by 1. pasting the broken link into WayBack Machine and clicking ‘Browse History’ 2. clicking on the latest capture date and then 3. clicking ‘view capture’. Please let us know of any broken web links by contacting us at enquiries@geotenerife.com.
Eruption footage
News and Interviews
Witness Testimonies
Interactive Lava Flow Map
Notes: Use the button in the top right to open the map into full screen mode. Use the legend icon in the top left to see the legend and further information about the map. Click on individual days to see an outline of the lava flows on that day.
Interactive Earthquake Map
click here to enlarge
Notes: The size of the points represents the size of the earthquake, and the colour represents the depth. The map will also only show a certain number of points at once. For ease of use, we recommend you uncheck all dates and the satellite basemap from the legend in the top right, and inspect the earthquakes one day at a time.
Sorry, the comment form is closed at this time.