17 Dec La Palma eruption update 17th december 2021: Risks still remain despite the lack of activity
La Palma eruption update 17th december 2021: Risks still remain despite the lack of activity
Daily summary
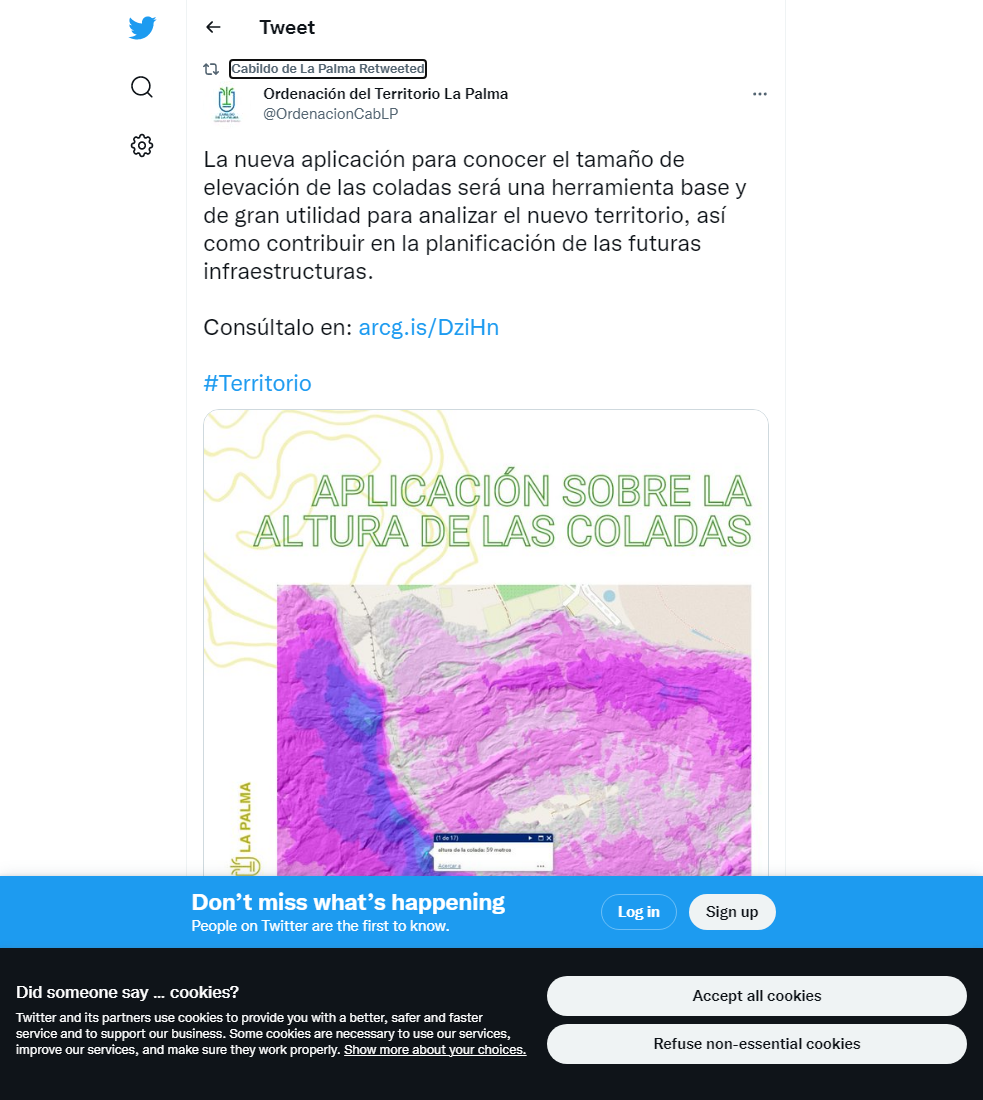
Volcanic tremor continues at background levels with no change and there remains no eruptive activity on the surface, apart from slight degassing from the main craters and areas where the roofs of lava tubes have collapsed. PEVOLCA again was keen to stress that the legal emergency situation and red traffic light are still maintained, as are the Civil Protection measures that have been in place since the start of the eruption.
The SO2 emissions from the plume have slightly increased, registering a medium (100-999 tonnes per day) value. However, PEVOLCA continues to explain these emissions are due to the solidification of superficial magma in the conduits, rather than magma ascent. Air quality with respect to SO2 and PM10 concentrations remain stable, and largely good. SO2 concentrations were good in all stations, as were PM10 levels in all stations except Los Llanos de Aridane, where unfavourable levels were recorded, although this represents a slight improvement from the previous day. As a precaution, people are advised to stay indoors where possible, and continue to wear FFP2 masks in Los Llanos de Aridane.
Deformation remains stable across the network, showing no trend. 50 earthquakes were recorded yesterday, peaking at M2.7. There have been no other signs of clusters of deep earthquakes (35-40km depth) which were seen in the early hours of the 16th, and the majority of earthquakes were at intermediate depths (<20 km). As in previous days, the number of events is inflated due to a number of small earthquakes (<M2.0) being detected and located, that would not be possible without the background tremor values seen currently. This represented 33 out of the 50 events recorded.
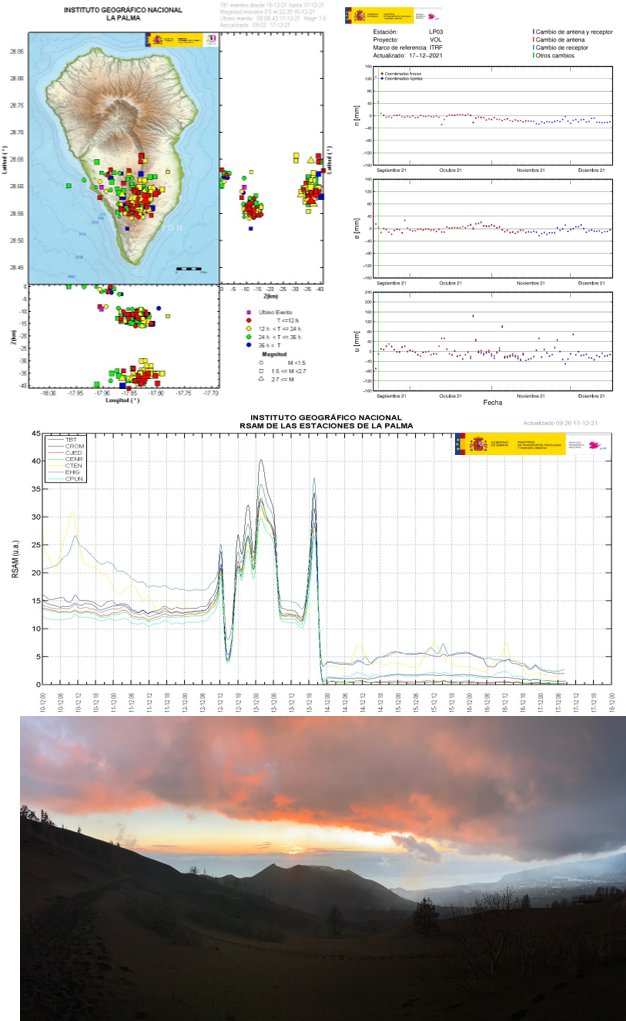
An overview of the eruption on the 17th December showing the earthquakes in the last 3 days (top left), the deformation since the start of the eruption at the GPS station closest to the eruption (top right) and the volcanic tremor since the start of the eruption (middle) across different frequencies. Note the lack of a tremor signal since late on the 13th. There is also an photo of the inactive cone taken from the east (bottom) Image credit: IGN Spain
Sources: Government of the Canary Islands, PEVOLCA, Involcan, IGN, DSN, Cabildo La Palma, 112 Canarias, Tolouse VAAC, Copernicus EMS
Lava flows

Earthquakes

Exclusion zone map
Exclusion zones shown here have been approximated from press releases from the Cabildo de La Palma and will not be exact, nor claim to be official maps of the exclusion zones. For official information, please contact the Cabildo de La Palma.

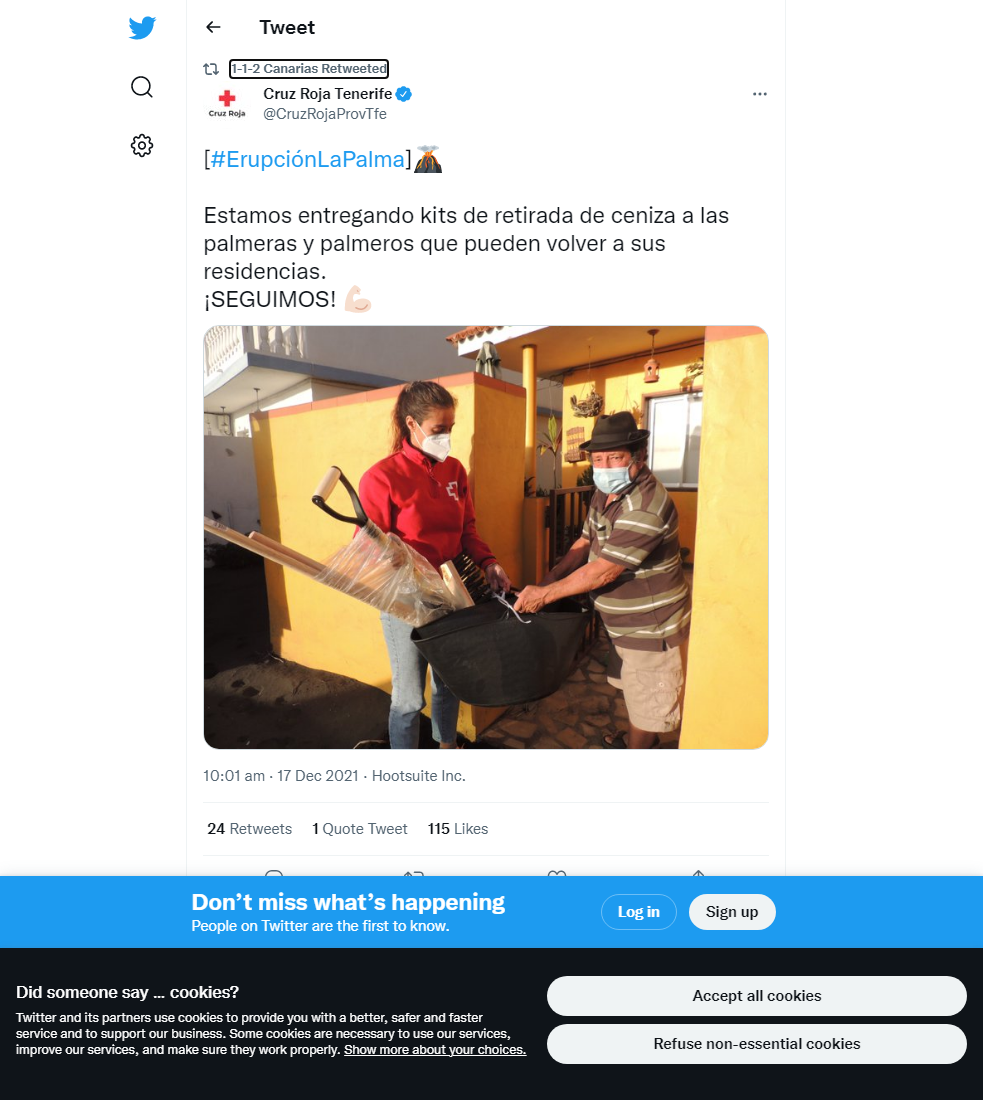
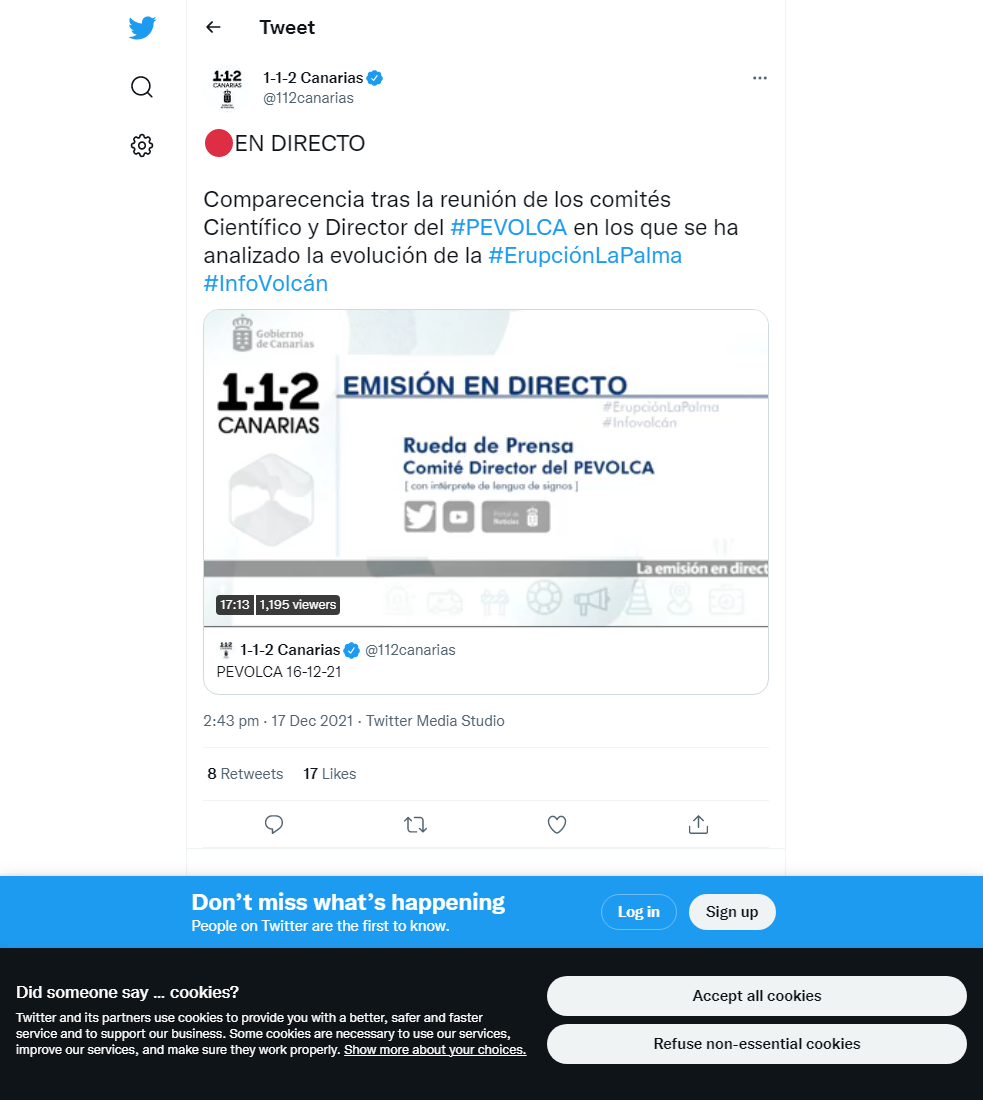
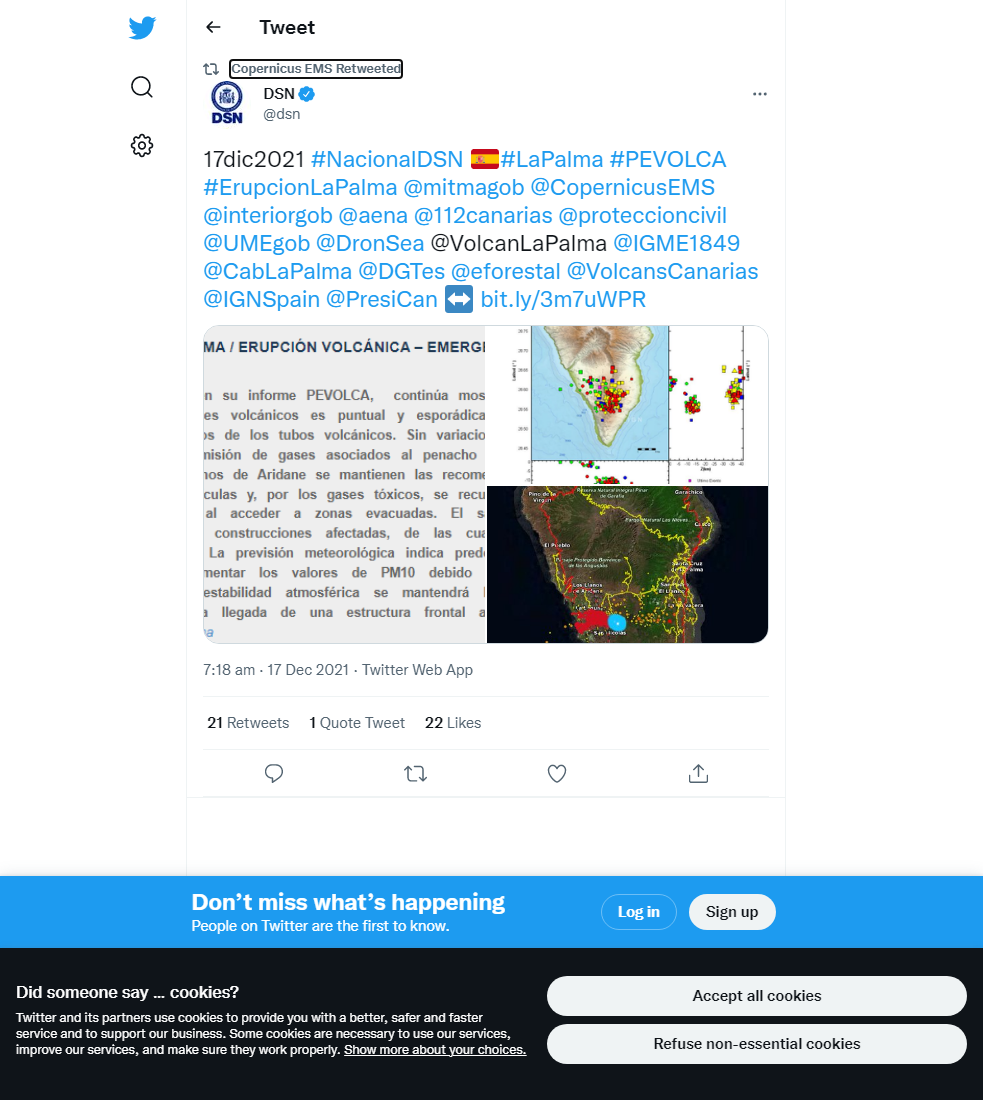
Official social media

To see our full social media archive, visit our open data section or click here.
News articles
- Consorcio de Compensación de Seguros – Details of management of losses due to the eruption – here
- El Mundo – Latest on the eruption – here
- MSN – Scientists cannot be sure the eruption is over – here
To see our full news archive, visit our open data section or click here.
Found a broken web link? We have archived all of our news articles on the WayBack Machine. You can view the pages by 1. pasting the broken link into WayBack Machine and clicking ‘Browse History’ 2. clicking on the latest capture date and then 3. clicking ‘view capture’. Please let us know of any broken web links by contacting us at enquiries@geotenerife.com.
Eruption footage
News and Interviews
Witness Testimonies
Interactive Lava Flow Map
Notes: Use the button in the top right to open the map into full screen mode. Use the legend icon in the top left to see the legend and further information about the map. Click on individual days to see an outline of the lava flows on that day.
Interactive Earthquake Map
click here to enlarge
Notes: The size of the points represents the size of the earthquake, and the colour represents the depth. The map will also only show a certain number of points at once. For ease of use, we recommend you uncheck all dates and the satellite basemap from the legend in the top right, and inspect the earthquakes one day at a time.
Sorry, the comment form is closed at this time.