01 Dec La Palma eruption update 1st december 2021: Sporadic activity continues in the main cone
La Palma eruption update 1st december 2021: Sporadic activity continues in the main cone
Daily summary
Eruptive activity from the vents in the main cone has continued to be sporadic, with the majority of the eruptive activity being concentrated in strombolian activity in the secondary cone on the NE flank of the main cone, which produces lava flows and pyroclasts. The northernmost flow, now called flow 12, continues to be fed by this cone and has a second branch travelling on top of flow 8 which is about 800 m from La Laguna. The latest data indicate 1,134 hectares have been affected by the lava flows, and the flow field reaches a maximum width of 3,350 m. Damage estimates from Copernicus estimate 2,860 buildings have been affected by the lava flows, whilst the land registry only estimates 1,548 buildings destroyed. Seismicity was once again very high. 336 events were recorded, with most being intermediate (10-15 km depth) events although some deep (30-45 km depth) events were recorded. The day’s largest earthquake which was a mbLg 4.0 event at 11 km depth.
Volcanic tremor has increased to an average level although shows sudden changes in level, whilst deformation now remains stable across the whole network except for some possible deformation signals at the station nearest the volcano, but these also show signs of meteorological origin. SO2 emissions were again measured at a ‘high’ level (1,000-29,999 tons per day), and the ash and gas plume heights were 3,500 m and 5,200 m respectively. As a general trend however, satellite measurements imply current SO2 emissions are lower than the start of the eruption. Air quality with respect to SO2 was improved and was at good levels across all stations on the island, and likewise PM10 concentrations were at good or reasonably good levels at all stations throughout the day.
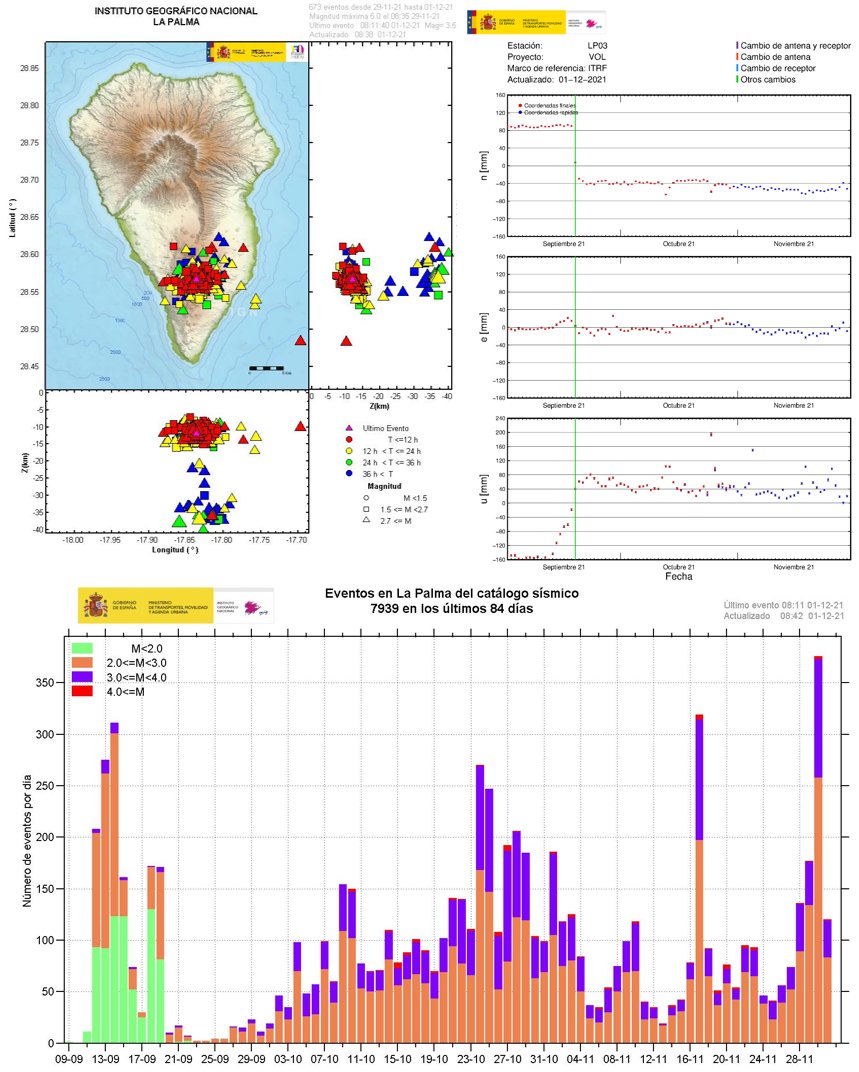
An overview of the eruption on the 1st December showing the earthquakes in the last 3 days (top left), the deformation since the start of the eruption at the GPS station closest to the eruption (top right) and the size and number of earthquakes since the seismic swarm preceding the eruption (bottom). Image credit: IGN Spain
Sources: Government of the Canary Islands, PEVOLCA, Involcan, IGN, DSN, Cabildo La Palma, 112 Canarias, Tolouse VAAC, Copernicus EMS
Lava flows

Earthquakes

Exclusion zone map
Exclusion zones shown here have been approximated from press releases from the Cabildo de La Palma and will not be exact, nor claim to be official maps of the exclusion zones. For official information, please contact the Cabildo de La Palma.

Official social media
To see our full social media archive, visit our open data section or click here.
News and Interviews
Witness Testimonies
Interactive Lava Flow Map
Notes: Use the button in the top right to open the map into full screen mode. Use the legend icon in the top left to see the legend and further information about the map. Click on individual days to see an outline of the lava flows on that day.
Interactive Earthquake Map
click here to enlarge
Notes: The size of the points represents the size of the earthquake, and the colour represents the depth. The map will also only show a certain number of points at once. For ease of use, we recommend you uncheck all dates and the satellite basemap from the legend in the top right, and inspect the earthquakes one day at a time.
Sorry, the comment form is closed at this time.