02 Dec La Palma eruption update 2nd december 2021: Secondary cone formed on the NE flank of the main cone
La Palma eruption update 2nd december 2021: Secondary cone formed on the NE flank of the main cone
Daily summary
Eruptive activity continues to be concentrated around the vent on the NE flank of the main cone that has formed a secondary cone of pyroclasts, with some intermittent ash and fumarolic activity from the main cone. The active lava flows now travel only over previous flows, through the centre of the flow field towards the northern lava delta at flow 7, and also along flow 8 along the northern margin of the lava flow field towards La Laguna. According to the latest stats from the Cadastre, 1,562 buildings have been destroyed, including 1,250 residential buildings and 163 for agricultural use. Seismicity decreased markedly compared to the last two days, especially in relation to intermediate depth (10-15 km) earthquakes. 98 events were recorded, with almost all of the events being at intermediate depths, with only a handful of deep (30-45 km depth) events. The day’s largest earthquake which was a mbLg 4.2 event at 11 km depth.
Volcanic tremor has remained at an average level although shows sudden changes in level, whilst deformation now remains stable close to the volcano but shows a very slight regional deflation signal at the more distal stations. SO2 emissions were again measured in the ‘high’ range (1,000-29,999 tons per day), and the ash and gas plume height was 1,900m. As a general trend however, satellite measurements imply current SO2 emissions are lower than the start of the eruption. Regarding air quality SO2 concentrations increased in the afternoon reaching regular to unfavourable levels in Tazacorte and Los Llanos respectively, with the latter exceeding the hourly limit threshold (350 μg/m3) at 6 pm local time. Elsewhere in the network, SO2 levels remained between good and reasonably good. PM10 concentrations remained at good or reasonably good in all stations except for Los Llanos, which suffered a brief peak of 418 μg/m3 at 2 pm local time, causing it to exceed the daily limit value (50 μg/m3).
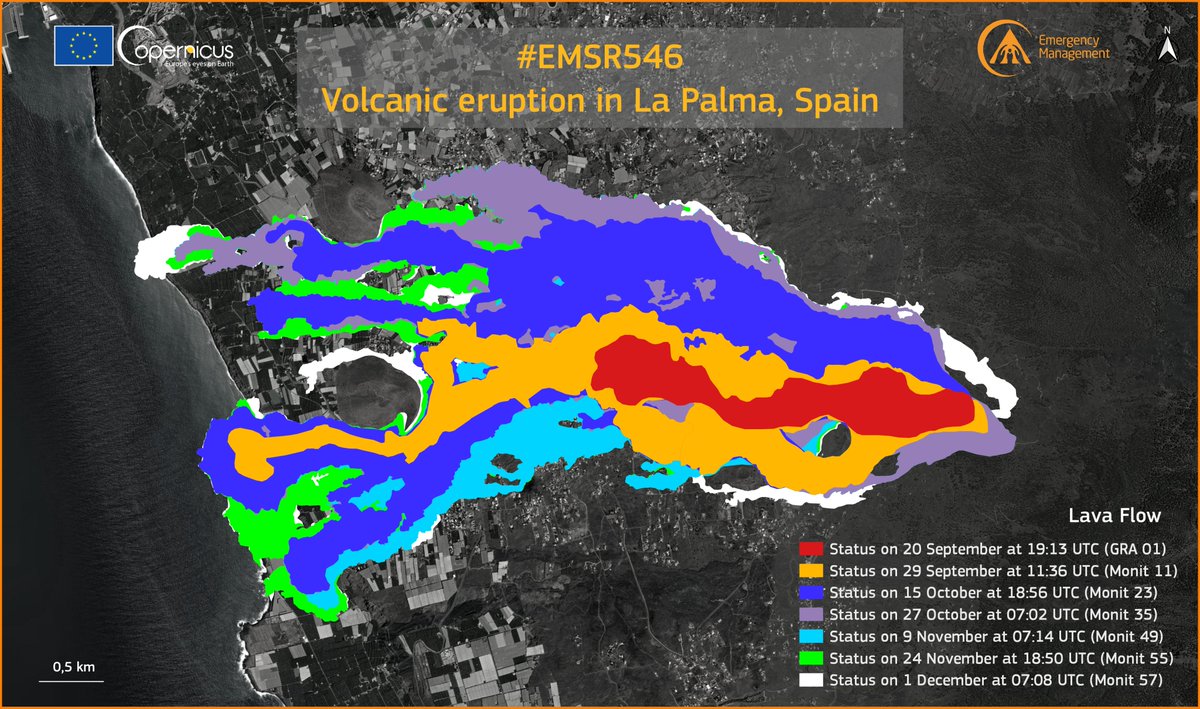
A map of the latest available extent of the lava flows, showing the additions from the new streams to the south through Las Manchas, the creation of the second lava delta to the north of the first one, and the new stream to the north of the lava flow generated by the new vent on the NE flank of the main cone. Image credit: Copernicus EMS
Sources: Government of the Canary Islands, PEVOLCA, Involcan, IGN, DSN, Cabildo La Palma, 112 Canarias, Tolouse VAAC, Copernicus EMS
Lava flows

Earthquakes

Exclusion zone map
Exclusion zones shown here have been approximated from press releases from the Cabildo de La Palma and will not be exact, nor claim to be official maps of the exclusion zones. For official information, please contact the Cabildo de La Palma.

Official social media
To see our full social media archive, visit our open data section or click here.
News articles
- EuroNews – La Palma: Authorities urge people to wear masks due to toxic gas – here
- Spanish News – The Canarian words popularized by the La Palma Volcano – here
- El País – Advancing lava poses a new threat – here
- Canary Islands Government – Damage asessment for fruit and veg – here
To see our full news archive, visit our open data section or click here.
Found a broken web link? We have archived all of our news articles on the WayBack Machine. You can view the pages by 1. pasting the broken link into WayBack Machine and clicking ‘Browse History’ 2. clicking on the latest capture date and then 3. clicking ‘view capture’. Please let us know of any broken web links by contacting us at enquiries@geotenerife.com.
Eruption footage
News and Interviews
Witness Testimonies
Interactive Lava Flow Map
Notes: Use the button in the top right to open the map into full screen mode. Use the legend icon in the top left to see the legend and further information about the map. Click on individual days to see an outline of the lava flows on that day.
Interactive Earthquake Map
click here to enlarge
Notes: The size of the points represents the size of the earthquake, and the colour represents the depth. The map will also only show a certain number of points at once. For ease of use, we recommend you uncheck all dates and the satellite basemap from the legend in the top right, and inspect the earthquakes one day at a time.
Sorry, the comment form is closed at this time.