02 Nov La Palma eruption update 2nd November 2021: Some schooling suspended due to poor air quality
La Palma eruption – 2nd November 2021
Daily summary
Due to the continued ashfall and low-level temperatures inversion causing poor air quality with respect to PM10 on the western side of the island, PEVOLCA have maintained the suspension of schooling in El Paso, Los Llanos de Aridane, Tazacorte, Puntagorda and Tijarafe. They will also continue the distribution of face masks and glasses to the population to mitigate the poor air quality. Regarding lava flows, flow 11 to the west of Cogote Mountain has slowed to 1m per hour, with most of the flows travelling in existing tubes of channels, with the most active flow being flow 9, which is the flow directly to the south of the first lava delta, resting on the low coastal plain of the lava delta created by the 1949 eruption. The latest estimate of area affected by the lava flows is 977 hectares, with a maximum width of the flow field of 3,100 m. The number of earthquakes decreased relative to the previous day, with 118 events almost all recorded at intermediate depths (10-15 km), with the day’s most powerful earthquake being a 4.1 mbLg earthquake at 12 km.
SO2 emissions were decreased and were measured at 9,600 tons per day continuing a slight downward trend relative to earlier in the eruption, although this is underestimated relative to satellite measurements, whilst the ash and gas plume reached 3700 m. The tremor showed a significant decrease at around noon local time, whilst deformation remains stable in the proximal GPS stations, whilst a slight regional deflation continues to be recorded in distal stations. Regarding air quality, the temperature inversion and wind direction presents unfavourable conditions for both the operation of La Palma airport and regional air quality in general. SO2 concentrations reached unfavourable levels between 7-9am local time at the Puntagorda station, which contributed to the exceedance of the daily limit threshold (125 µg/m³) at this station. In the rest of the stations, good or reasonably good SO2 levels were measured. PM10 concentrations reached extremely unfavourable levels in Los Llanos, with an average of 183 µg/m³ (daily threshold is 50 µg/m³. In the rest of the stations PM10 levels were good or reasonably good.
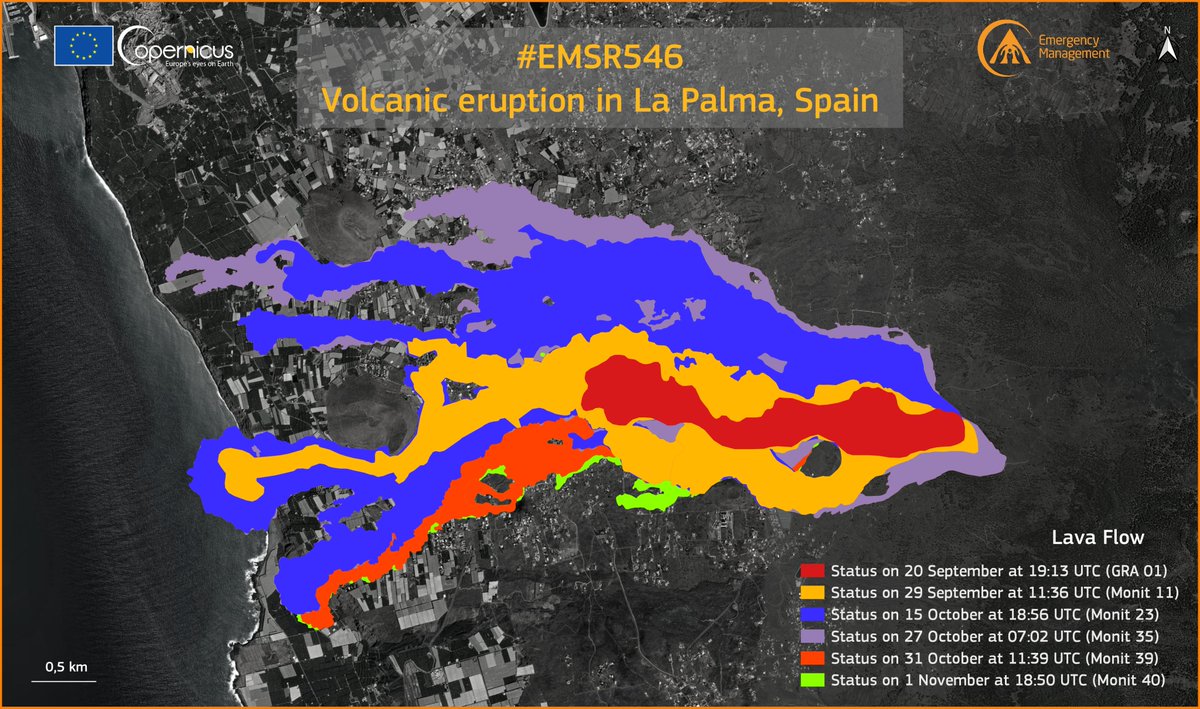
The latest available data on the extent of the lava flows, showing the progress made to the south of the flow field in the last week. Image credit: Copernicus EMS
Sources: Government of the Canary Islands, PEVOLCA, Involcan, IGN, DSN, Cabildo La Palma, 112 Canarias, Tolouse VAAC, Copernicus EMS
Lava flows

Earthquakes

Exclusion zone map
Exclusion zones shown here have been approximated from press releases from the Cabildo de La Palma and will not be exact, nor claim to be official maps of the exclusion zones. For official information, please contact the Cabildo de La Palma.
")
Official social media
To see our full social media archive, visit our open data section or click here.
News articles
- El Pais – Sweeping ash – here
- Eure Reporter – Interview with victims of the eruption – here
- Daily Express – Megatsunami and Bill McGuire fake news – here
- UCL – Megatsunami and Bill McGuire fake news (reported as fact) – here
To see our full news archive, visit our open data section or click here.
Found a broken web link? We have archived all of our news articles on the WayBack Machine. You can view the pages by 1. pasting the broken link into WayBack Machine and clicking ‘Browse History’ 2. clicking on the latest capture date and then 3. clicking ‘view capture’. Please let us know of any broken web links by contacting us at enquiries@geotenerife.com.
Eruption footage
News and Interviews
Witness Testimonies
Interactive Lava Flow Map
Notes: Use the button in the top right to open the map into full screen mode. Use the legend icon in the top left to see the legend and further information about the map. Click on individual days to see an outline of the lava flows on that day.
Interactive Earthquake Map
click here to enlarge
Notes: The size of the points represents the size of the earthquake, and the colour represents the depth. The map will also only show a certain number of points at once. For ease of use, we recommend you uncheck all dates and the satellite basemap from the legend in the top right, and inspect the earthquakes one day at a time.
Sorry, the comment form is closed at this time.