04 Dec La Palma eruption update 4th december 2021: Activity shifts to the SE flank of the main cone
La Palma eruption update 4th december 2021: Activity shifts to the SE flank of the main cone
Daily summary
Throughout the day, the surface activity of the volcano was variable, with the northeast vent that was been the most active over the last week stopping, and the foci of the eruption switching to vents on the southeast flank of the main cone, which showed intermittent strombolian activity. This switch led to the reactivation of the lava flows to the south of Cogote Mountain, which occupy new land to the south of the flow field, although they were viscous and moved slowly. However, in the early evening, it was reported that new emission centres aligned east-west appeared lower down the southern flow west of the Las Manchas cemetery. These are emitting very fluid lava, speeding up the advance of the new lava flow and affecting further land.
Only 41 earthquakes were recorded yesterday by IGN, showing a continuing decrease in the seismic activity, with most again being concentrated at shallow-intermediate depths (10-15 km). In terms of deformation, the inflation episode reported at the LP03 station near Jedey has partially reversed, and the rest of the network continues to show stability with a very gradual deflation trend seen at some of the more proximal stations to the eruption. The emission of SO2 continues to be high from the volcano however, which indicates the presence of magma to feed the eruption, although the SO2 concentrations in nearby towns remained at reasonably good to good at all stations apart from Los Llanos de Aridane, Tazacorte and Puntagorda where the levels were regular. It has been made clear by PEVOLCA that any forecasts of the end of eruption cannot be made until we see sustained low SO2 emissions from the volcano, regardless of the level of surface activity, seismicity and deformation.
PM10 concentrations were increased across the island, especially in the east, due in part to winds bringing a haze of Saharan dust to the island. However, they remained reasonably good at all stations aside from La Grama (Breña Alta), where they reached unfavourable levels, prompting advice to stay inside if at all possible and wear FFP2 masks when outside.
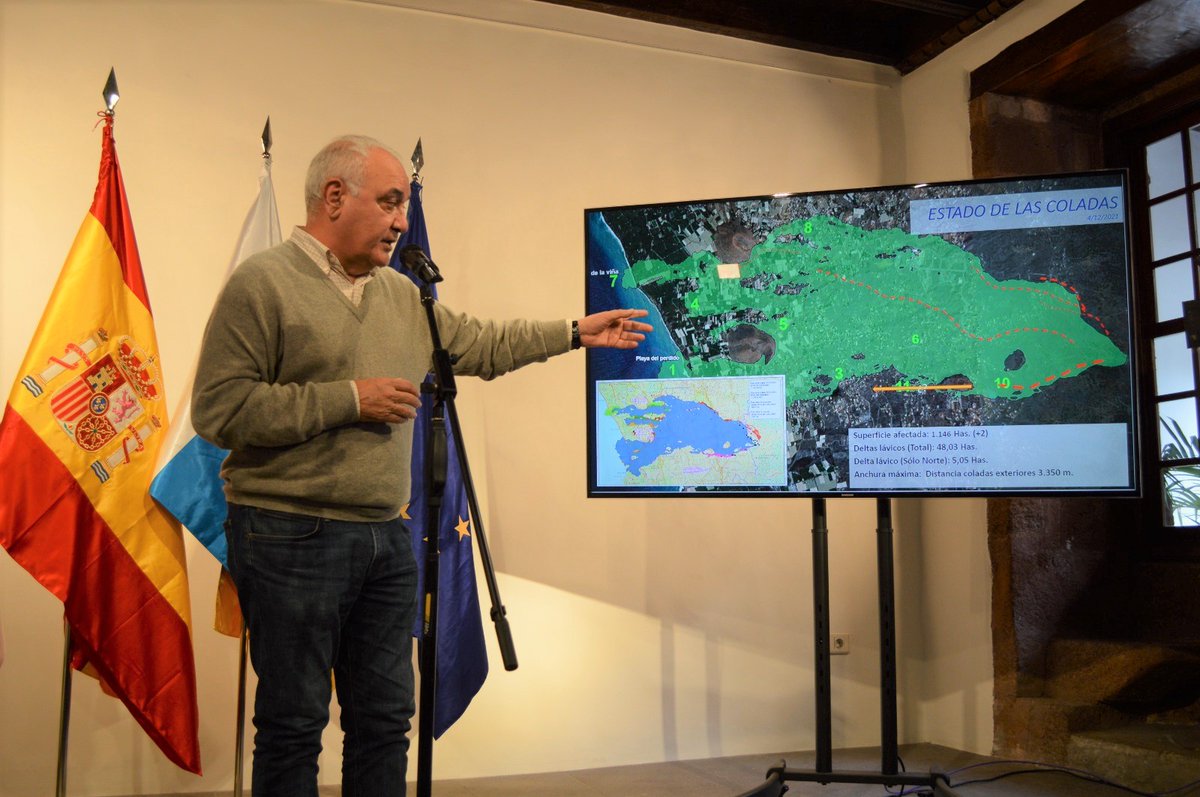
The latest lava flow map showing the directions of the active flows (red dotted lines) are shown during the daily PEVOLCA meeting with technical director Miguel Ángel Morcuende. Image credit: PEVOLCA, 112 Canarias
Sources: Government of the Canary Islands, PEVOLCA, Involcan, IGN, DSN, Cabildo La Palma, 112 Canarias, Tolouse VAAC, Copernicus EMS
Lava flows

Earthquakes

Exclusion zone map
Exclusion zones shown here have been approximated from press releases from the Cabildo de La Palma and will not be exact, nor claim to be official maps of the exclusion zones. For official information, please contact the Cabildo de La Palma.

Official social media
To see our full social media archive, visit our open data section or click here.
News articles
To see our full news archive, visit our open data section or click here.
Found a broken web link? We have archived all of our news articles on the WayBack Machine. You can view the pages by 1. pasting the broken link into WayBack Machine and clicking ‘Browse History’ 2. clicking on the latest capture date and then 3. clicking ‘view capture’. Please let us know of any broken web links by contacting us at enquiries@geotenerife.com.
Eruption footage
News and Interviews
Witness Testimonies
Interactive Lava Flow Map
Notes: Use the button in the top right to open the map into full screen mode. Use the legend icon in the top left to see the legend and further information about the map. Click on individual days to see an outline of the lava flows on that day.
Interactive Earthquake Map
click here to enlarge
Notes: The size of the points represents the size of the earthquake, and the colour represents the depth. The map will also only show a certain number of points at once. For ease of use, we recommend you uncheck all dates and the satellite basemap from the legend in the top right, and inspect the earthquakes one day at a time.
Sorry, the comment form is closed at this time.