08 Dec La Palma eruption update 8th december 2021: Some of the evacuated people have been permitted to return
La Palma eruption update 8th december 2021: Some of the evacuated people have been permitted to return
Daily summary
Mixed activity continues to be seen from the main cone, with strombolian activity and ash emission coming from multiple vents at fluctuating intensity and explosivity, as well as some more effusive phases producing lava flows. Fluid lava flows continue to be emitted from the effusive focus to the west of the main cone. At this time, the lava flows flow west through multiple lava tubes and all head towards flow 9 at the southern margin of the current lava deltas. The cracks and fractures observed in the secondary NE cone in the last days have not shown any relevant changes, and have been attributed to the cooling and contraction of the cone when it became inactive on the 4th December. Due to the stagnation of the lava flows to the NW, evacuees from the Calle Nicolás Brito País and Las Martelas de Abajo areas of Los Llanos De Aridane are allowed to return home this morning.
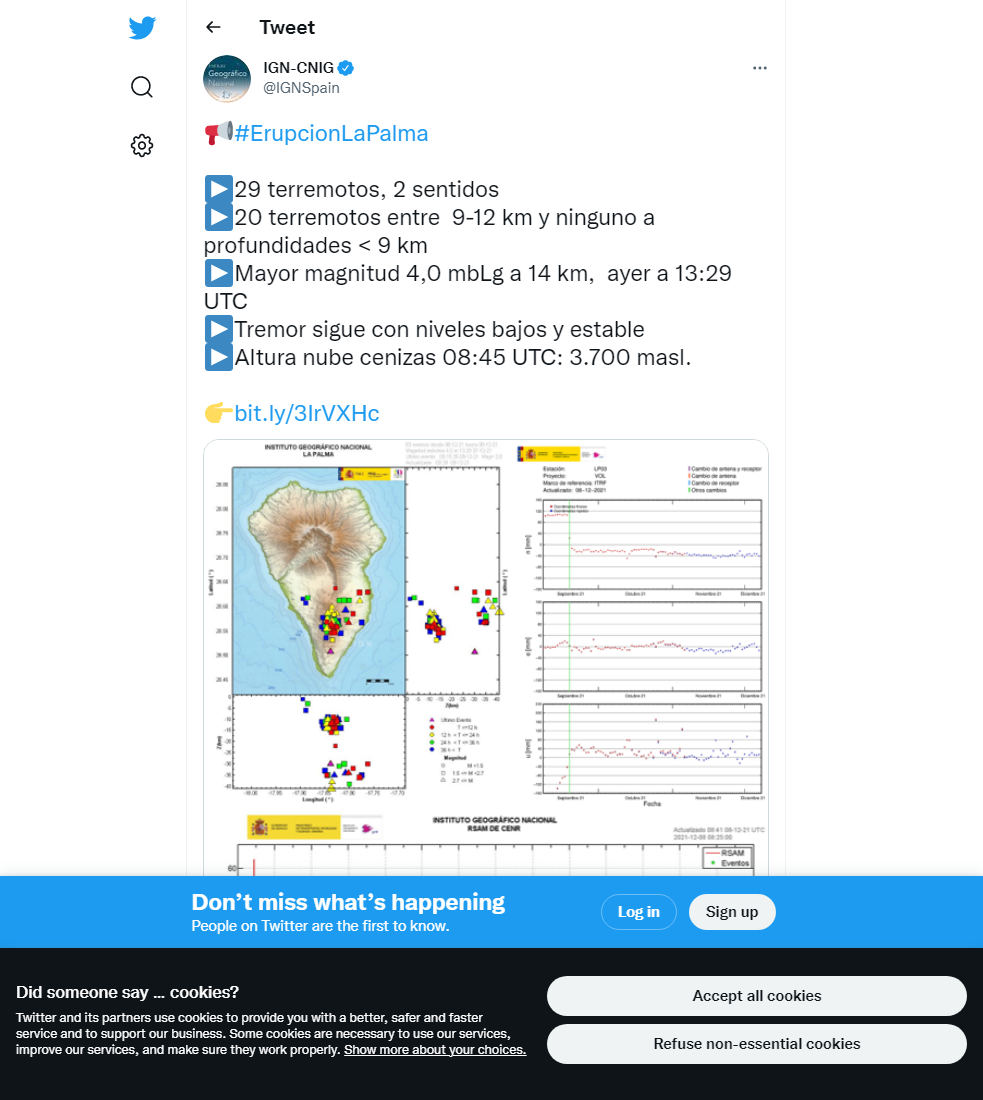
Seismicity remains low, with 40 events yesterday peaking at M3.6, although there is a noticeably greater share of events at deep (>20 km) depths relative to the last few days. Seismic tremor has remained low and at similar levels to yesterday but shows less variability. With respect to deformation, the situation remains the same, with no trends seen near the eruptive centre, and stability being seen in the rest of the network.
SO2 emissions in the volcanic plume remain high (1-30,000 tonnes per day), although this continues to reflect a downward trend. Access to the evacuated zone for neighbours was allowed on the 8/12 from the north and the south (but only from the sea), although strong trade winds today (9/12) mean no access is allowed to the zone from any entrance. Elsewhere, SO2 concentrations reached extremely unfavourable levels yesterday morning in Los Llanos de Aridane, Tazacorte and Puntagorda, but remained at good or reasonably good levels in the rest of the stations. PM10 levels decreased yesterday everywhere apart from La Grama and Los Llanos de Aridane where they reached unfavourable levels.
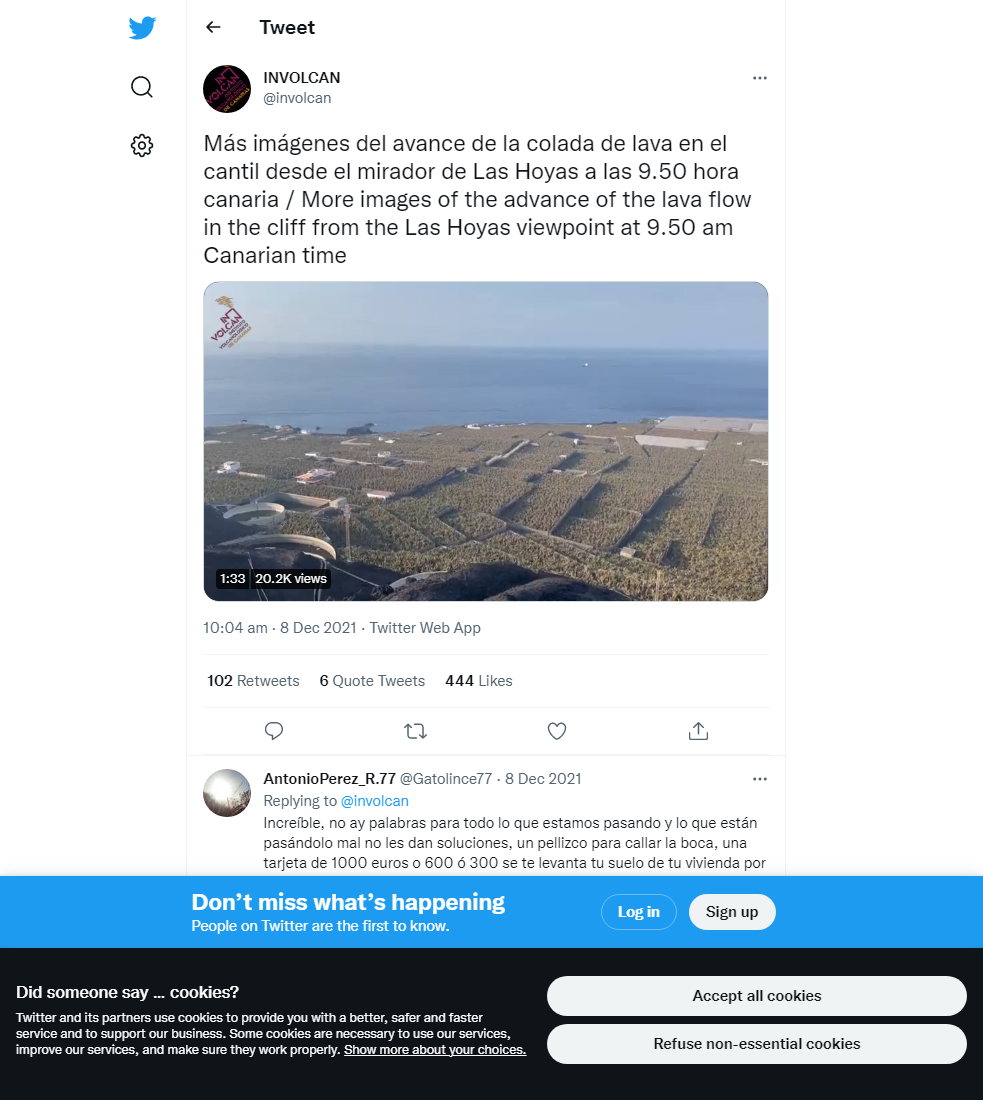
(Above) A video of the new lava flow to the south cascading down the cliffs at Las Hoyas, just south of the existing southern lava delta. Video credit: INVOLCAN
Sources: Government of the Canary Islands, PEVOLCA, Involcan, IGN, DSN, Cabildo La Palma, 112 Canarias, Tolouse VAAC, Copernicus EMS
Lava flows

Earthquakes

Exclusion zone map
Exclusion zones shown here have been approximated from press releases from the Cabildo de La Palma and will not be exact, nor claim to be official maps of the exclusion zones. For official information, please contact the Cabildo de La Palma.

Official social media


To see our full social media archive, visit our open data section or click here.
News articles
- RTVE – Eruption briefly pauses – here
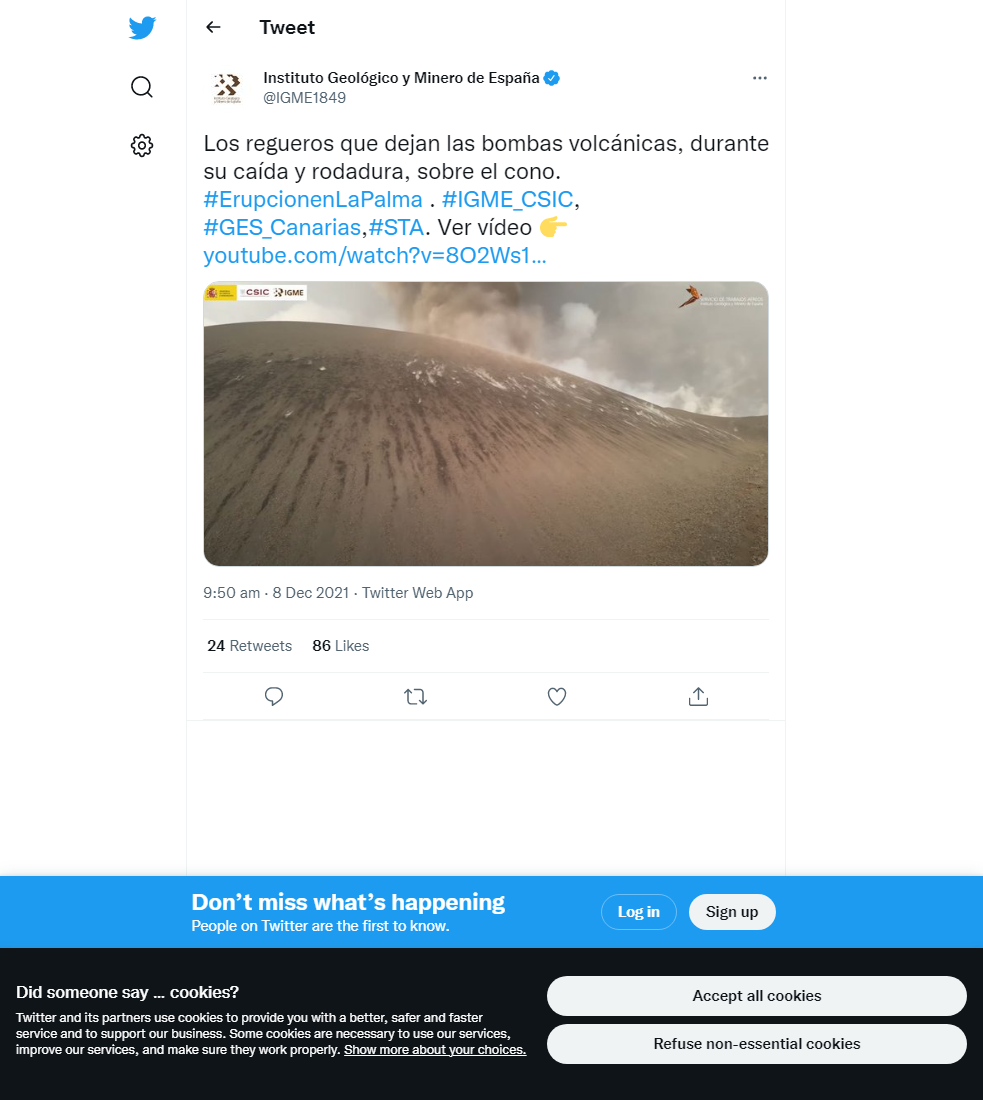
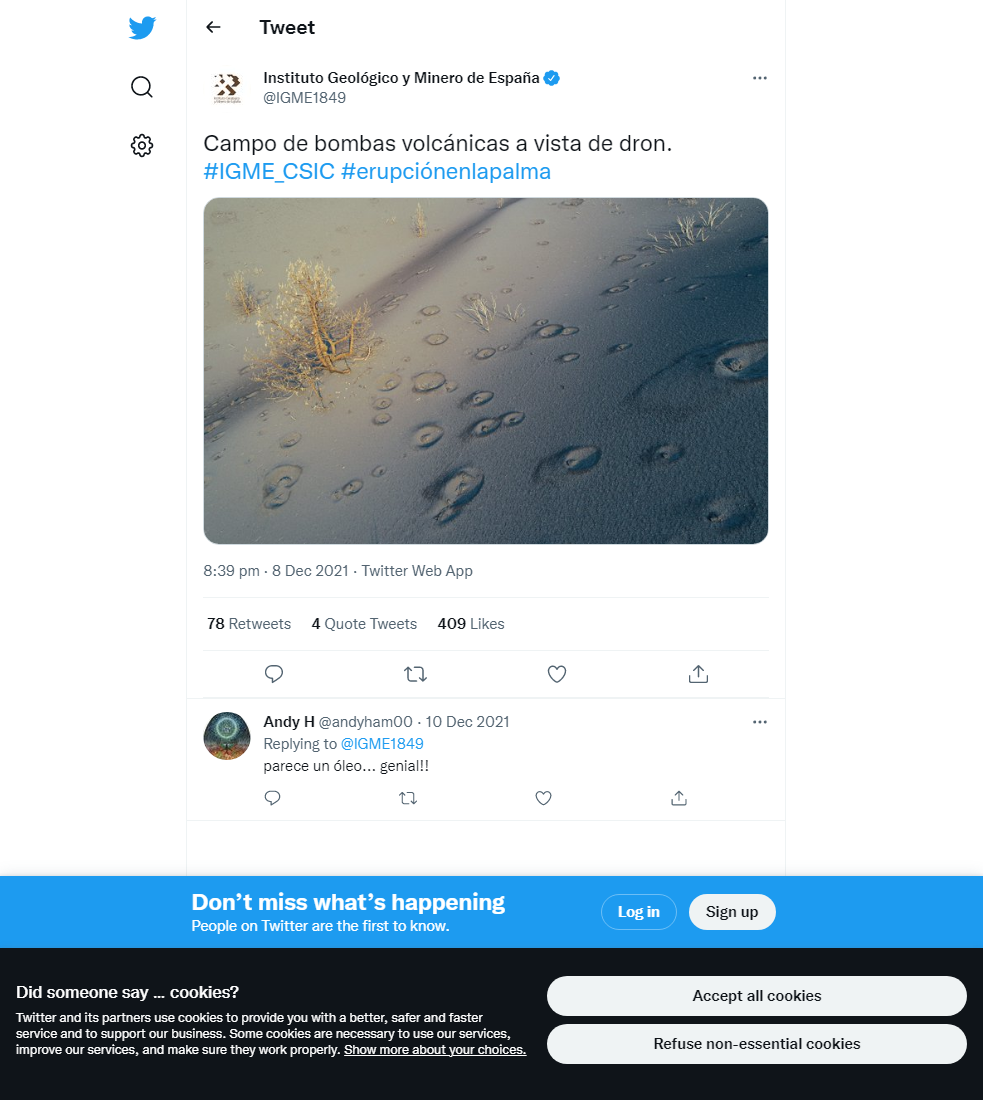
- Independent Fr – Volcanic bombs roll down the flanks of the cone – here
To see our full news archive, visit our open data section or click here.
Found a broken web link? We have archived all of our news articles on the WayBack Machine. You can view the pages by 1. pasting the broken link into WayBack Machine and clicking ‘Browse History’ 2. clicking on the latest capture date and then 3. clicking ‘view capture’. Please let us know of any broken web links by contacting us at enquiries@geotenerife.com.
Eruption footage
News and Interviews
Witness Testimonies
Interactive Lava Flow Map
Notes: Use the button in the top right to open the map into full screen mode. Use the legend icon in the top left to see the legend and further information about the map. Click on individual days to see an outline of the lava flows on that day.
Interactive Earthquake Map
click here to enlarge
Notes: The size of the points represents the size of the earthquake, and the colour represents the depth. The map will also only show a certain number of points at once. For ease of use, we recommend you uncheck all dates and the satellite basemap from the legend in the top right, and inspect the earthquakes one day at a time.
Sorry, the comment form is closed at this time.