19 Oct La Palma eruption update 19th october 2021: The northern lava front is 100 m from the coast
La Palma eruption update 19th october 2021: The northern lava front is 100 m from the coast
Daily summary
The self-protection recommendation announced yesterday for the population of El Paso, in the face of continuing unfavourable air quality with respect to PM10 concentrations, has been maintained. Residents should stay indoors as much as possible, particularly between 2pm-9pm local time, and wear an FFP2 mask if they must go outside. The active lava flows continue to advance slowly; the flow south of La Laguna Mountain is around 100 m from the coast, moving at 3-5 m per hour, and the northernmost flow is currently heading for the centre of La Laguna, although its path is less certain. Between the main cone and the ash vent that opened on the 16th October, a new vent opened in the afternoon, initially showing phreatomagmatic activity before transitioning into Stromolian activity. More findings from the chemical analysis of the lava have been published, showing the evolution from more differentiated to more primitive magma occurred contemporaneously with the hiatus of surface activity on the 27th September.
SO2 concentrations remained generally lower, although higher values were recorded throughout the day in the Puntagorda, San Antonio (Breña Baja), and La Grama stations. During the night of the 19th, prolonged intense SO2 concentrations, reaching but not exceeding the alert threshold (500 μg/m3) were measured in Puntagorda. PM10 concentrations were generally lower due to the weakening of the Saharan air mass, however there were peaks at the Los Llanos and El Pilar stations (Santa Cruz de La Palma) at 10:00am local time of >450 μg/m3, contributing to the exceedance of the daily threshold (50 μg/m3) in Los Llanos, El Pilar and La Grama stations. Earthquake activity remained similar to previous days and contained both intermediate (10-15 km) and deep (>20 km) earthquakes. 70 events were recorded, peaking at 4.7 mbLg. Deformation remains stable at stations closest to the eruption, although a slight regional deflation is recorded further from the eruption. The ash and gas plume reached 5000 m, and the SO2 emissions from the volcano were within ranges seen in previous days, at 7,513 tons per day, although this is an underestimate.
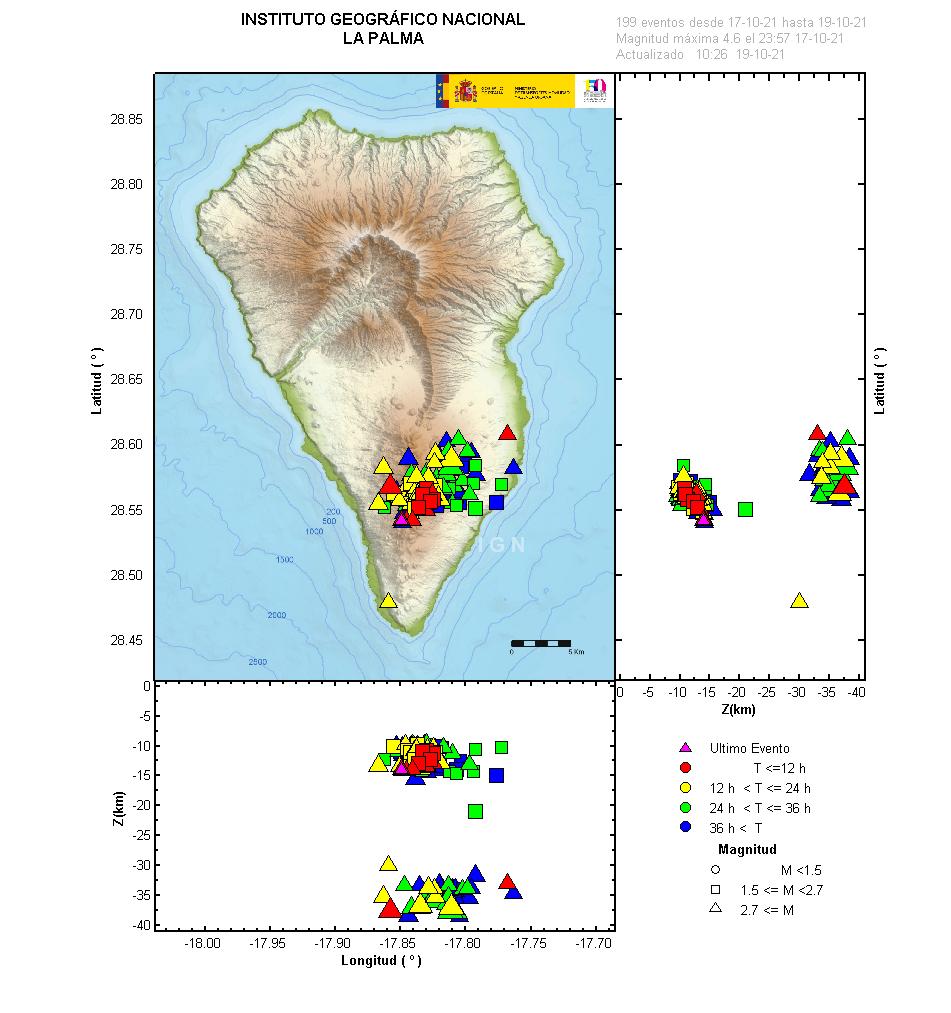
The earthquakes of the last 3 days recorded by the seismic network on the island. It can be noted that the earthquakes are still clustered at two different depths, and that compared to the early stages of the eruption a more equal proportion of the earthquakes are split between the two depths. Image credit: IGN Spain
Sources: Government of the Canary Islands, PEVOLCA, Involcan, IGN, DSN, Cabildo La Palma, 112 Canarias, Tolouse VAAC, Copernicus EMS
Lava flows

Earthquakes

Exclusion zone map
Exclusion zones shown here have been approximated from press releases from the Cabildo de La Palma and will not be exact, nor claim to be official maps of the exclusion zones. For official information, please contact the Cabildo de La Palma.

Official social media
To see our full social media archive, visit our open data section or click here.
News articles
To see our full news archive, visit our open data section or click here.
Found a broken web link? We have archived all of our news articles on the WayBack Machine. You can view the pages by 1. pasting the broken link into WayBack Machine and clicking ‘Browse History’ 2. clicking on the latest capture date and then 3. clicking ‘view capture’. Please let us know of any broken web links by contacting us at enquiries@geotenerife.com.
Eruption footage
News and Interviews
Witness Testimonies
Interactive Lava Flow Map
Notes: Use the button in the top right to open the map into full screen mode. Use the legend icon in the top left to see the legend and further information about the map. Click on individual days to see an outline of the lava flows on that day.
Interactive Earthquake Map
click here to enlarge
Notes: The size of the points represents the size of the earthquake, and the colour represents the depth. The map will also only show a certain number of points at once. For ease of use, we recommend you uncheck all dates and the satellite basemap from the legend in the top right, and inspect the earthquakes one day at a time.
Sorry, the comment form is closed at this time.